Rooftop solar power has taken Australia by storm, with more than 10% of suitable rooftops now decked out with solar panels across the country. Different sizes of solar PV systems have proliferated depending on which incentives & what prices were available at the time of installation, as well as on the electricity needs of the home or business in question.
Generally speaking, 15 kilowatts (kW) is the upper limit for residential solar systems in Australia because a system of this size will produce sufficient electricity to meet a home’s daytime electricity needs. An 8kW solar system–just between the 15kW upper limit and extremely popular 6.6kW solar systems–would be ideally suited for a home with slightly higher electricity demand than average.
How many solar panels and roof space do you need for a 8kW solar system?
These days solar panels usually come in rated somewhere between 330 watt (W) to 400W. That means for 8kW solar system (or 8,000 watts) you will require 20-24 solar panels. This number has reduced a lot over the last decade as the efficiency of solar panels has improved.
Each panel generally measures out to 1.7m2. You also need to take into consideration the space required between the panels for maintenance and access, along with exclusion zones near the edges and ridges of the roof. For a typical 8kW system you will require 45 – 60m2 of roof space.
Compare solar quotes from up to 7 local installers now.
How much does an 8kW solar system cost?
Fortunately in Australia there is a federal rebate (called the STC rebate) which covers around 30-35% of the upfront costs of installing solar, mean we have some of the cheapest prices for solar anywhere in the world.
Every month Solar Choice publishes solar system prices from across Australia based on raw pricing data from our installer network into the Solar Choice Price Index. Based on this data from September 2025, we can see that on average an 8kW solar system would cost $7,467 in Australia after the STC rebate has been deducted and including GST. The below table breaks down the costs for a 8kW system by state and calculates the cost per watt:
Average 8kW solar panel prices based on Solar Choice Price Index | ||
| City | Out of pocket cost (incl GST and incentives) | Cost per watt, installed |
| Adelaide | $6,810 | $0.85 |
| Brisbane | $7,270 | $0.97 |
| Canberra | $6,790 | $0.93 |
| Hobart | $9,650 | $1.05 |
| Melbourne | $7,500 | $0.84 |
| Sydney | $6,830 | $0.85 |
| Perth | $7,420 | $0.80 |
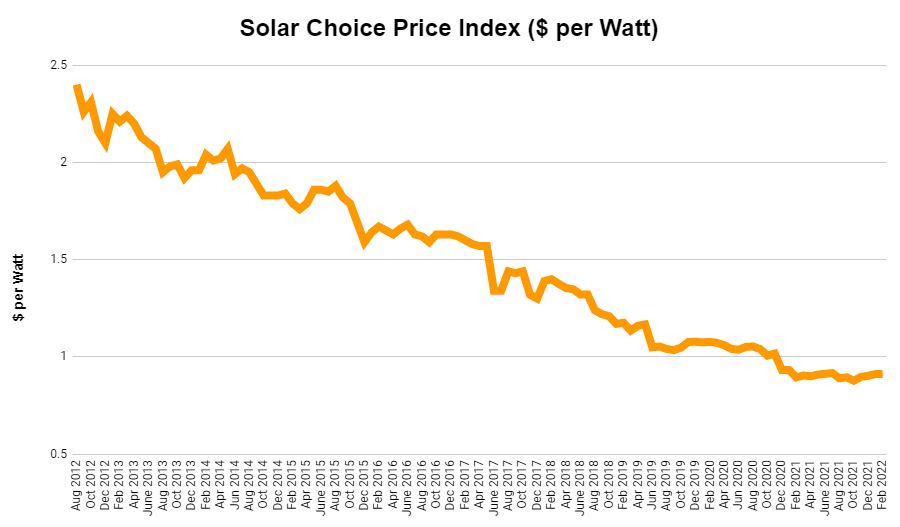
In the below graph you can see that the price of solar has fallen significantly over the last decade but is starting increase with the rising costs of solar panels and the reduction in the STC rebate.
Compare solar quotes from up to 7 local installers now.
How much energy will a 8kW solar system produce?
As with any solar PV system, actual power output for an 8kW system will depend on a number of variables.
- Location and climate
- Tilt & orientation of the solar panels
- Presence or absence of shading
- How hot the solar panels get (overheating can reduce power output, while cooler conditions are generally more favourable)
- The quality and sizing of the system’s inverter(s)
- The performance of these and other components in the system
Perhaps the most basic factor included in the list above is the amount of sunlight that is available in a given region. The metric used by the solar industry to measure solar potential is ‘Peak Sun Hours’ (PSH). A Peak Sun Hour is the equivalent of one hour of full sunlight. As the sun moves through the sky, the strength of the rays it casts on a particular location varies. Most places experience peak sun around noon or 1pm, while sunshine is weaker in the late afternoon and early morning.
The good news is that we have worked this out for you. See the below table which breaks down the output in all the major cities in Australia:
Indicative daily 8kW solar panel output by capital city | ||
| City | Average Daily Production | Estimated Annual Production |
| Adelaide | 31 kWh per day | 11,242 kWh |
| Brisbane | 32 kWh per day | 11,680 kWh |
| Canberra | 31 kWh per day | 11,242 kWh |
| Darwin | 35 kWh per day | 12,848 kWh |
| Hobart | 25 kWh per day | 9,052 kWh |
| Melbourne | 27 kWh per day | 9,782 kWh |
| Perth | 34 kWh per day | 12,264 kWh |
| Sydney | 29 kWh per day | 10,512 kWh |
Assumptions
- kWh figures worked out using PVWatts and historical sunlight data from the Bureau of Meteorology
- The systems efficiency is conservatively estimated to be 75% for the whole system
- For this exercise, we have assumed the panels are north-facing with a tilt of 30 degrees
8kW solar systems: Payback & Returns
Like solar system output, payback periods and returns on investment for a solar system of any size are dependent on a number of factors. The main things that make solar power such an excellent investment in Australia are the relatively low cost of having a system installed and the high cost of electricity.
Meanwhile, state-based solar feed-in tariffs, which were once the primary incentive mechanism for going solar, have been reduced and relegated to a less important reason for going solar. Feed-in tariffs are now either voluntary or minimal in most of Australia–meaning that an electricity retailer is not required to pay solar homes and businesses anything for their excess power. Understanding the implications of this is key to getting the most out of a system.
Focus on solar self-consumption of solar power is now the rule
If you own a solar system, you will want to consume as much of the power it produced as possible because this will save you the greatest amount of money on your power bill. The rates for electricity purchased from retailers (anywhere from 18¢-27¢ or more depending on the location, retailer, and tariff in question) are significantly higher than the feed in tariffs offered by the same retailers for excess solar power.
We have put together an overview of some typical scenarios for consumers considering an 8kW solar system. Please take note we have assumed the energy usage is 35 kWh per day on average which is higher than the average in Australia.
Indicative payback periods for 8 kW solar panel systems (September 2025)
| City | System Cost | Electricity Price | Feed-in Rate | Daily Usage | IRR | Annual Savings (Y1) | Payback Period |
|---|---|---|---|---|---|---|---|
| Adelaide | $6,810 | 35c | 8c | 40 kWh | 36% | $2,356 | 2.9 yrs |
| Brisbane | $7,270 | 26c | 6c | 40 kWh | 23% | $1,611 | 4.5 yrs |
| Canberra | $6,790 | 29c | 7c | 40 kWh | 27% | $1,791 | 3.8 yrs |
| Hobart | $9,650 | 33c | 8c | 40 kWh | 22% | $2,094 | 4.6 yrs |
| Melbourne | $7,500 | 22c | 5c | 40 kWh | 20% | $1,529 | 4.9 yrs |
| Perth | $7,420 | 31c | 6c | 40 kWh | 27% | $1,956 | 3.8 yrs |
| Sydney | $6,830 | 29c | 7c | 40 kWh | 30% | $1,997 | 3.4 yrs |
Assumptions:
- We have assumed the household average daily energy usage is 35 kWh per day (higher than average energy usage)
- The prices are based on the latest Solar Choice Price Index
- Self-consumption rates of 30% (low) and 60% (very high) have been selected as examples only and as you can see are very important to the financial outcome
- See the cheapest electricity rates in your state
- See the best feed in tariffs by state
 You can calculate the outcome for your own circumstances with the Solar Choice Payback Calculator
Since 2008 our knowledge and sophisticated software has allowed over 300,000 Australian households and businesses to make a well-informed choice on their solar & battery installer.
- APsystems Battery Review: An Independent Assessment by Solar Choice - 18 December, 2025
- Running Cost of Air Conditioners – Explained - 7 October, 2025
- Air Conditioner Rebate South Australia: What You Need to Know - 19 September, 2025


Hi Solarchoice, would consider extending your pv business to Nigeria? I am looking for offshore technical partners to help me PV/Storage Battery engineering designs for construction and installation in Nigeria. I have electrical engineering background and would handle installation locally. Thank you
Hi Edmund. Thanks for the approach but we only operate in Australia and do not have plans to expand overseas at this point.