This page is an appendix to our recent article: “Is home solar battery storage worth it in 2018?”
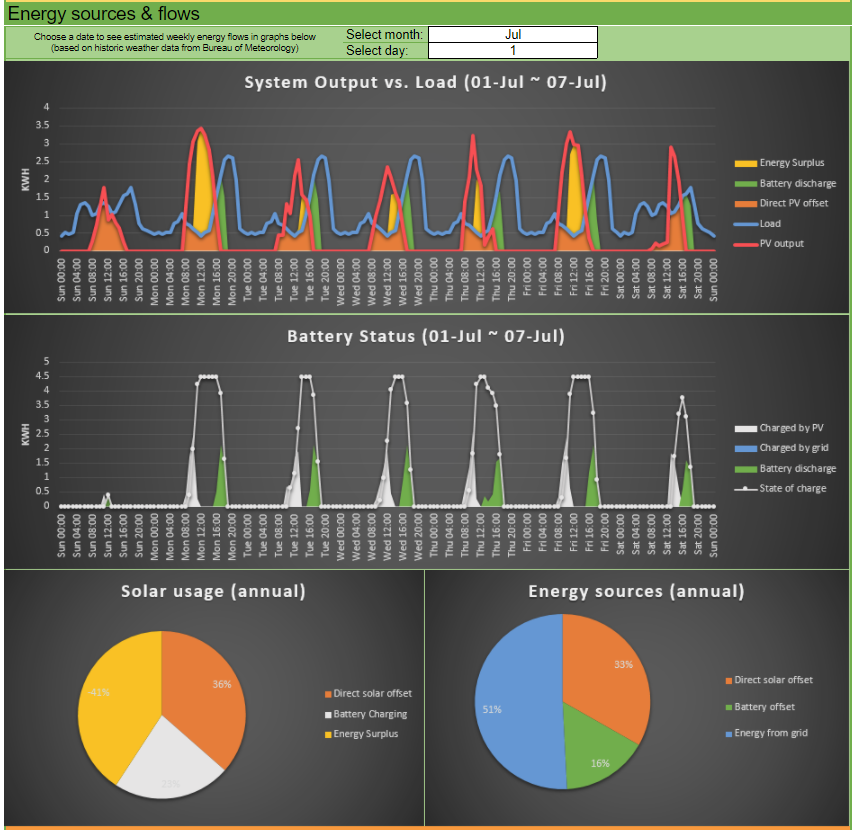
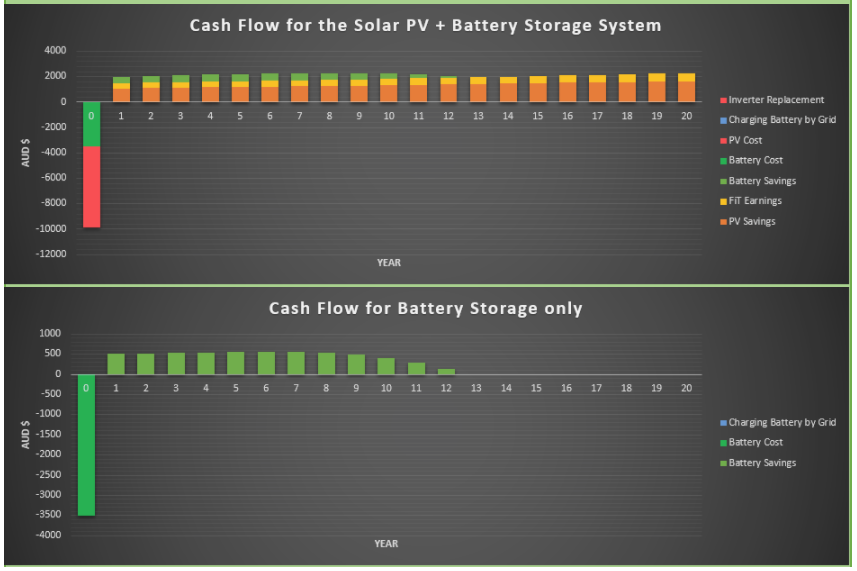
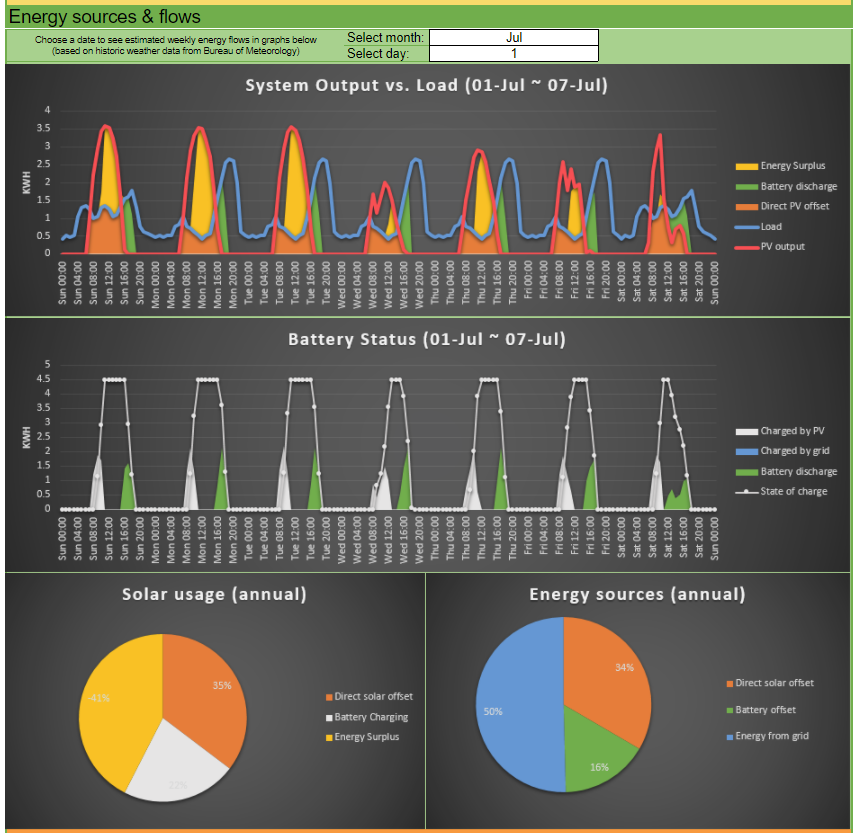
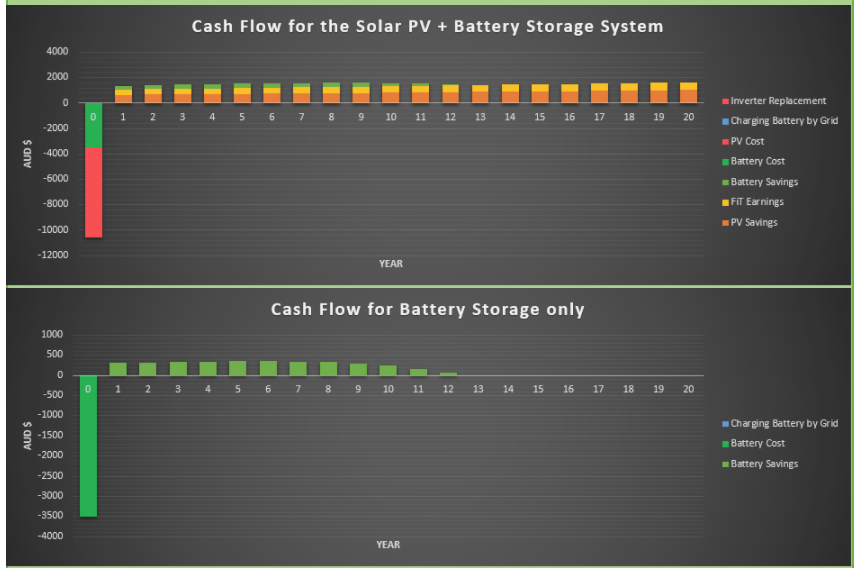
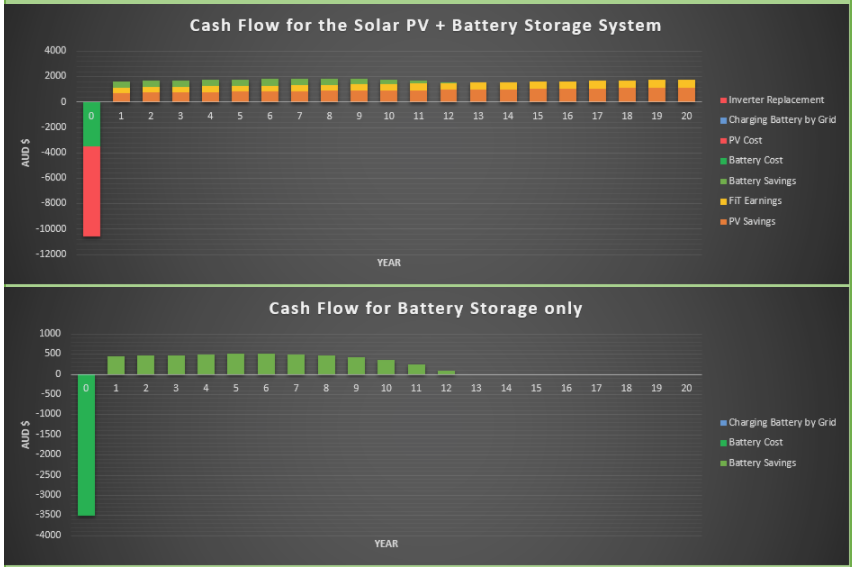
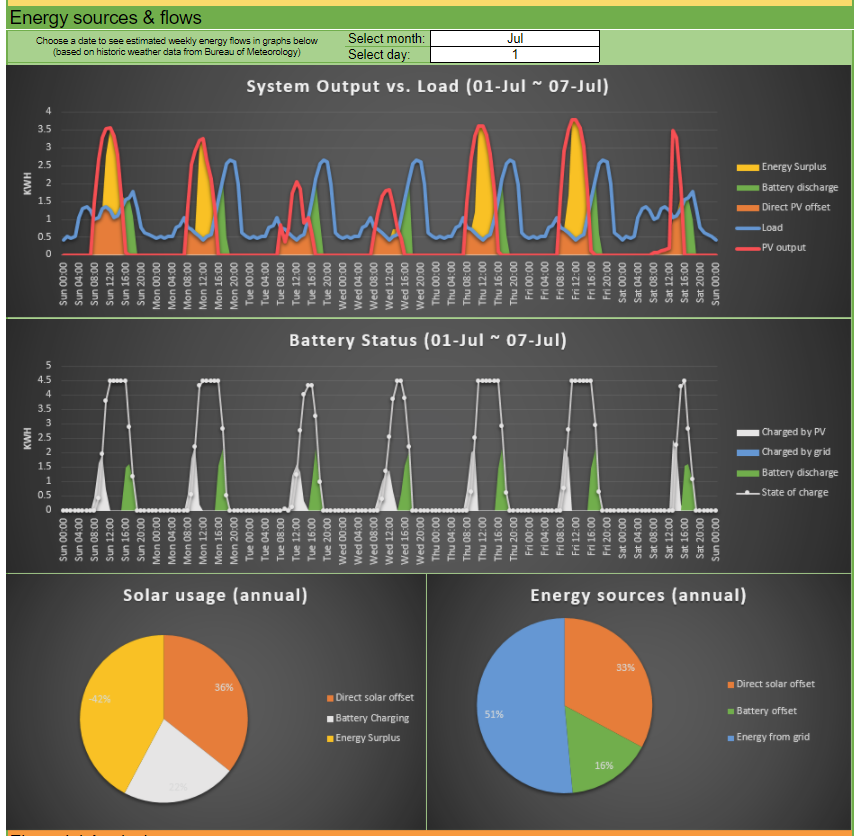
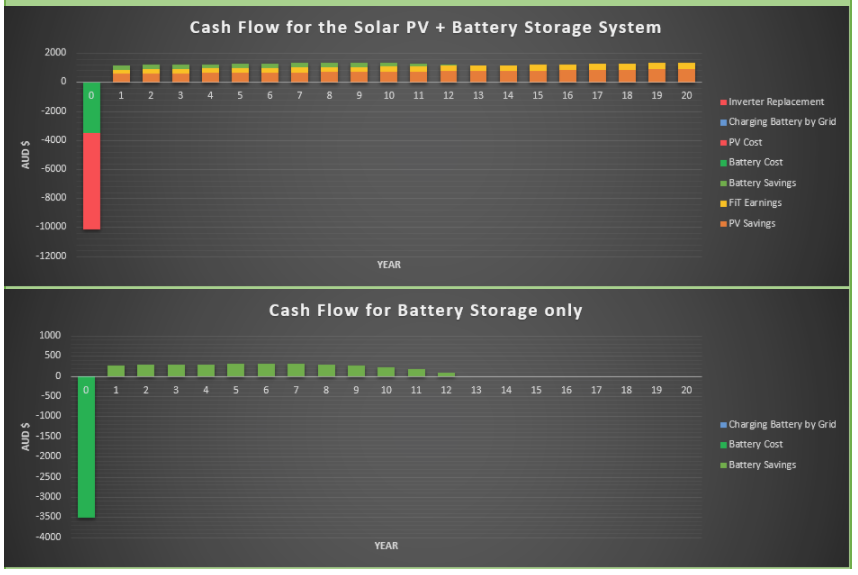
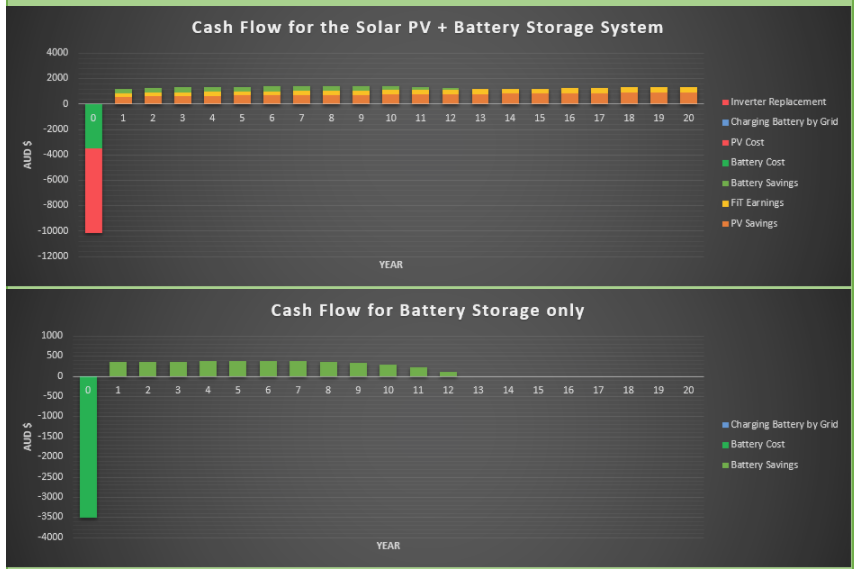
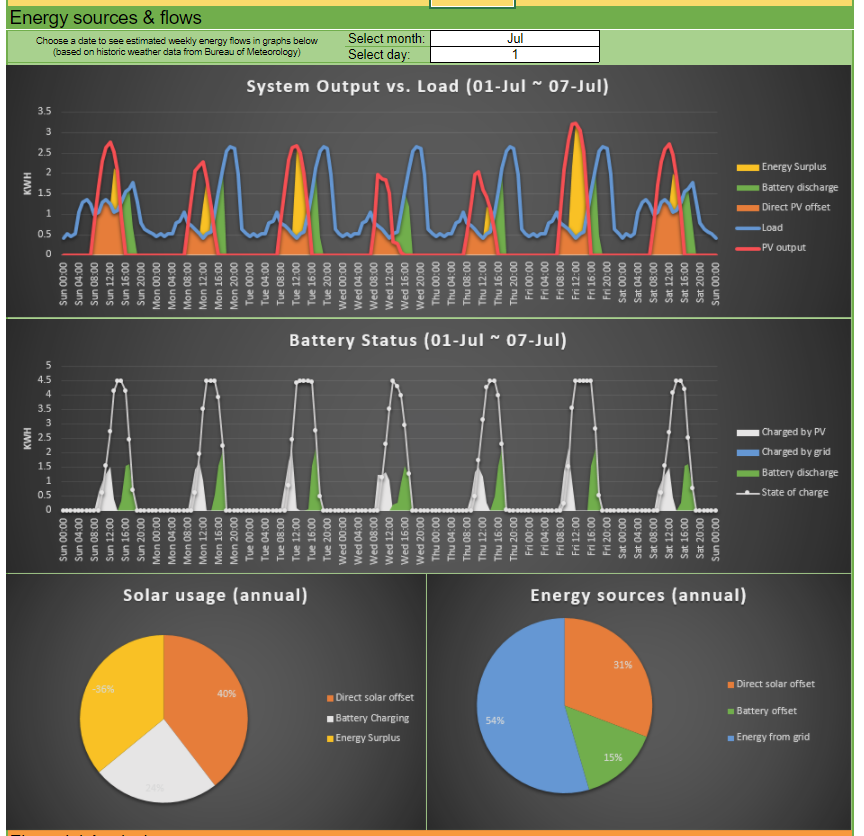
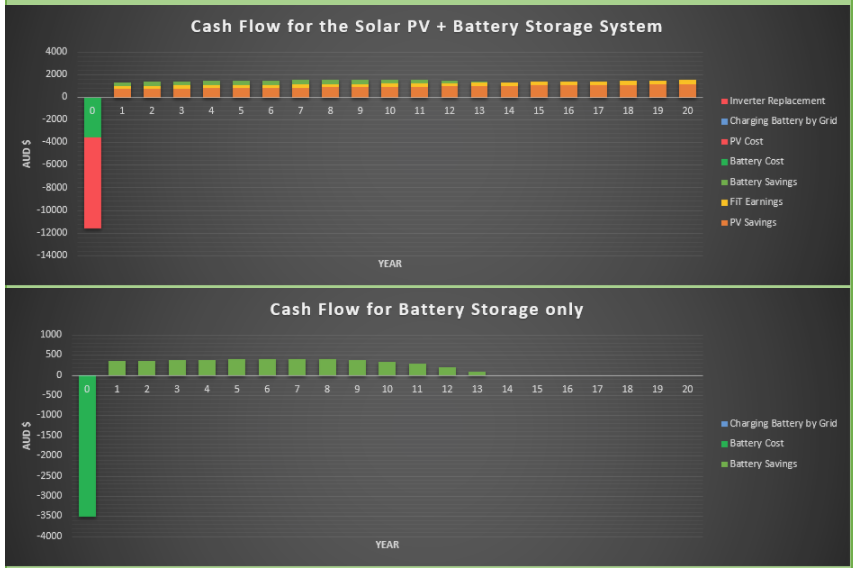
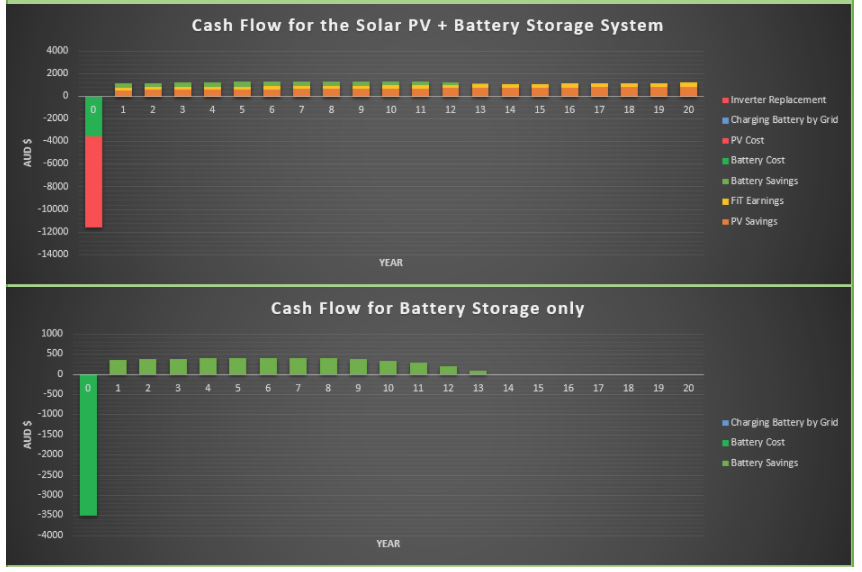
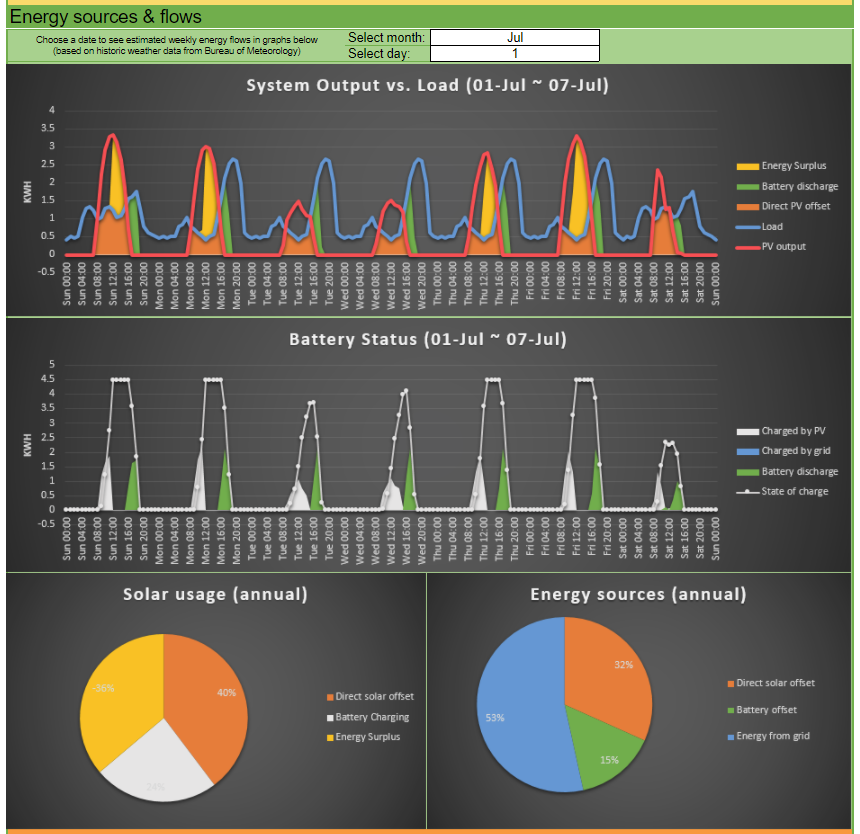
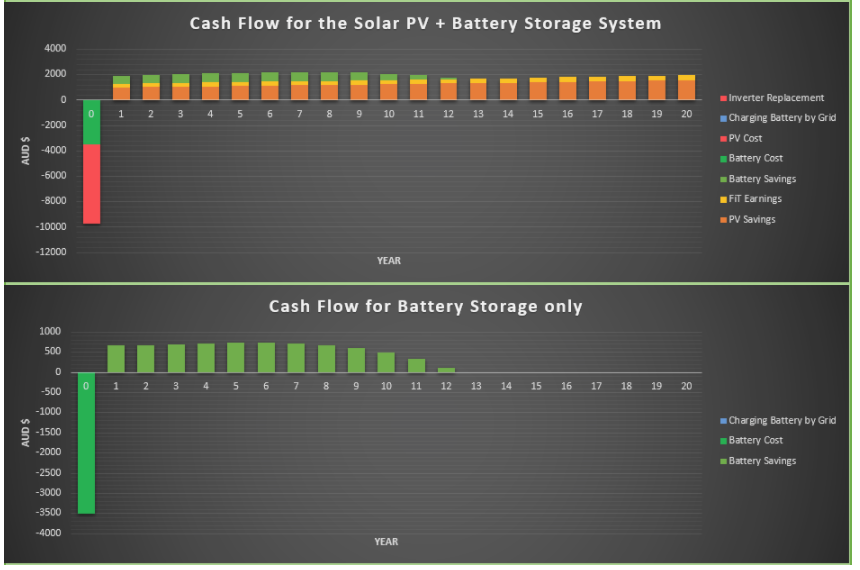
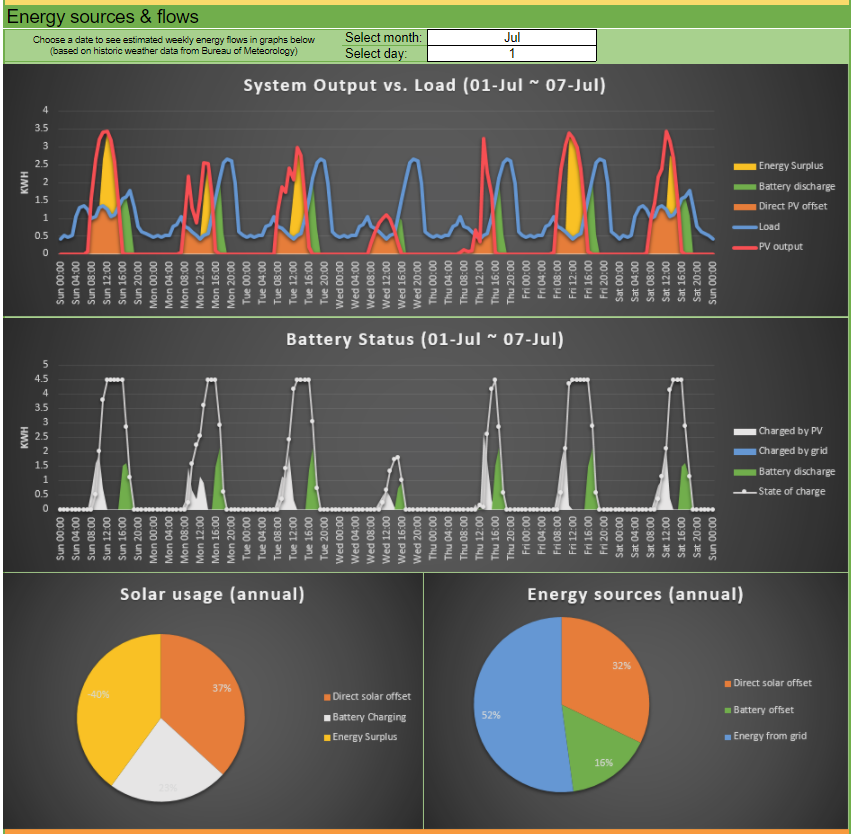
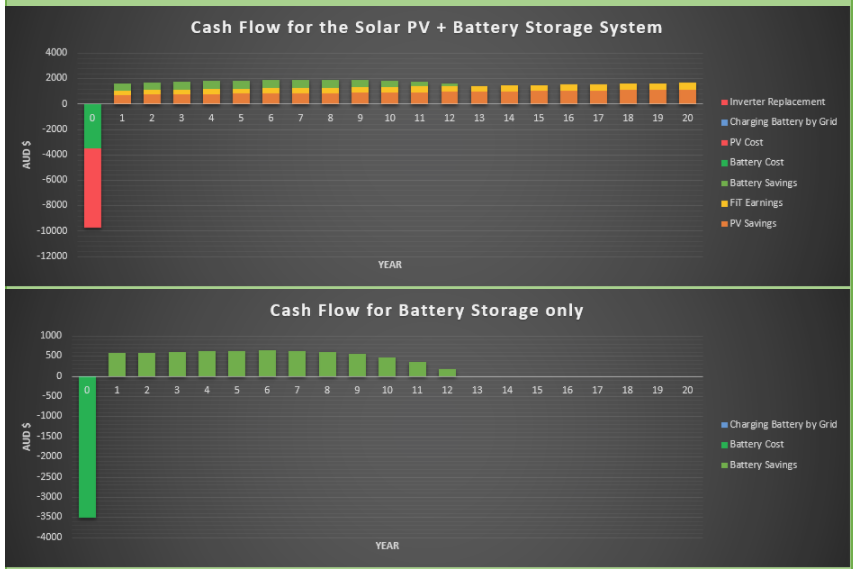
The infographic gallery below provides snapshots of total system cost, payback periods, return on investment and other key performance indicators for a 5kW solar system plus Sungrow’s PowCube in each Australian capital city.
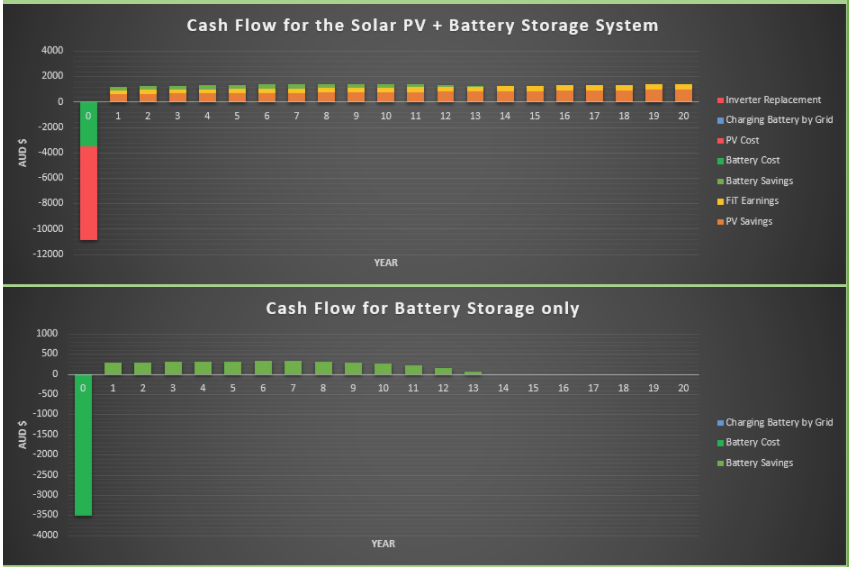
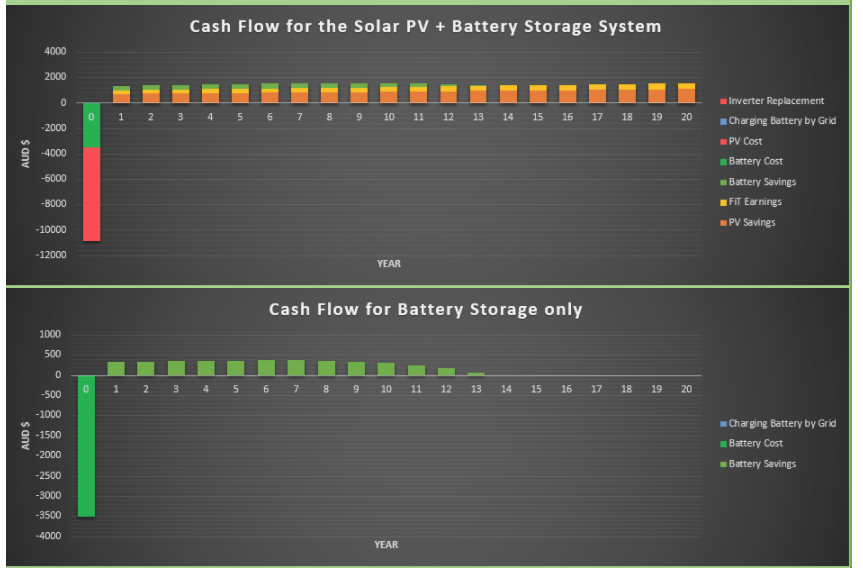
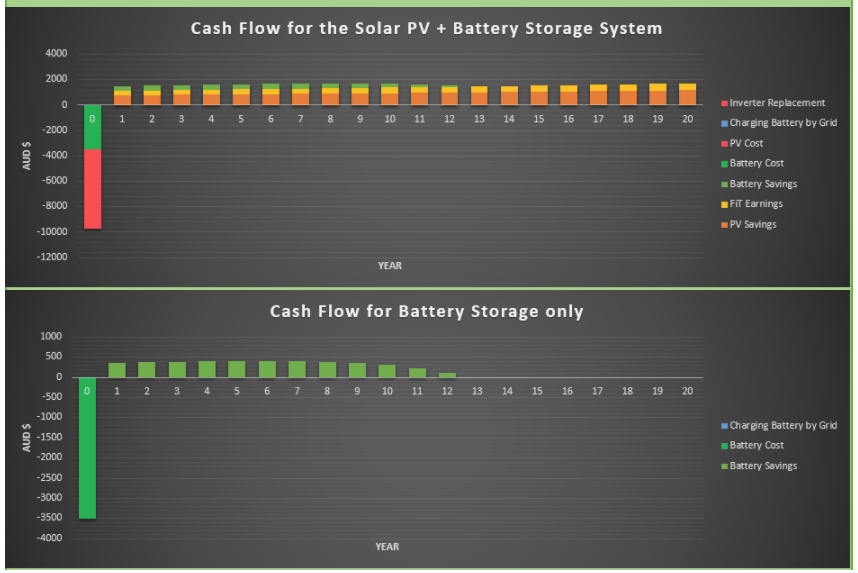
Two scenarios have been modelled for each city: one for customers on a flat or block retail electricity tariff, and a second for customers on a time of use (TOU) tariff.
Please note that all results are indicative only.
All infographics were created using Solar Choice’s Solar & Battery Storage Sizing & Payback Calculator.
Adelaide, SA
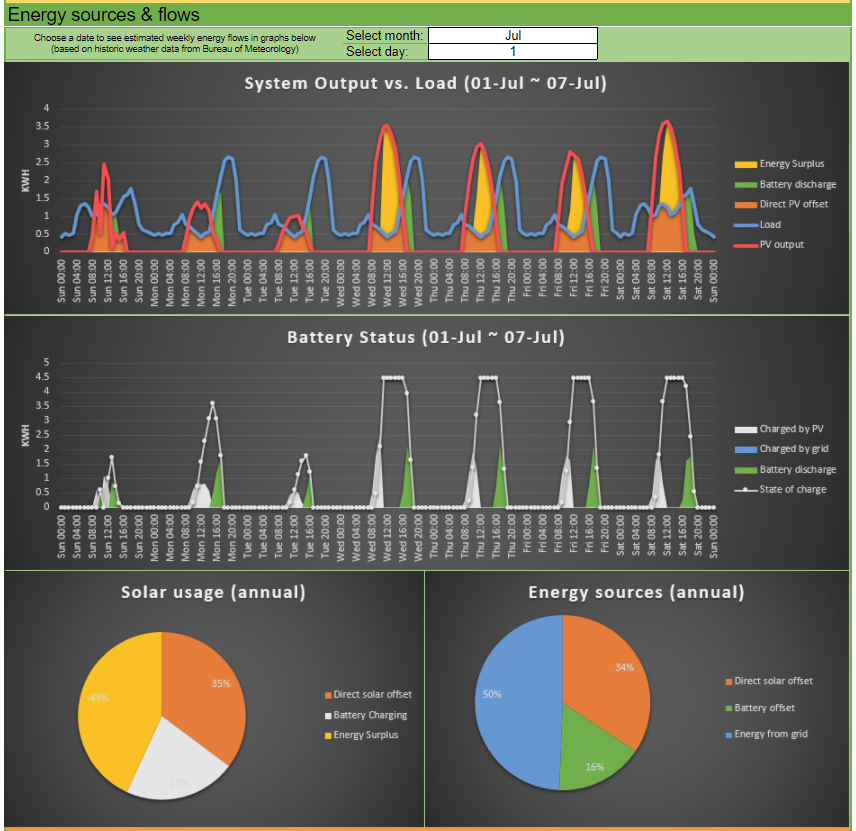
Energy flows & energy independence stats.
Cash flows on flat rate tariff.
Brisbane, QLD
Energy flows & energy independence stats.
Cash flows on flat rate tariff.
Cash flows on time of use tariff.
Canberra, ACT
Energy flows & energy independence stats.
Cash flows on flat rate tariff.
Cash flows on time of use tariff.
Darwin, NT
Darwin residents are eligible for a solar feed-in rate equal to their retail electricity rate, which means that batteries will only reduce potential savings when installed alongside a grid-connected solar system. Therefore we have not included results for Darwin in this analysis. If you’d like to estimate payback periods for grid-connected solar systems (without batteries) in Darwin, check out our Solar System Payback Estimator Tool.
Hobart, TAS
Energy flows & energy independence stats.
Cash flows on flat rate tariff.
Cash flows on time of use tariff.
Melbourne, VIC
Energy flows & energy independence stats.
Cash flows on flat rate tariff.
Cash flows on time of use tariff.
Perth, WA
Energy flows & energy independence stats.
Cash flows on flat rate tariff.
Cash flows on time of use tariff.
Sydney, NSW
Energy flows & energy independence stats.
Cash flows on flat rate tariff.
Cash flows on time of use tariff.
