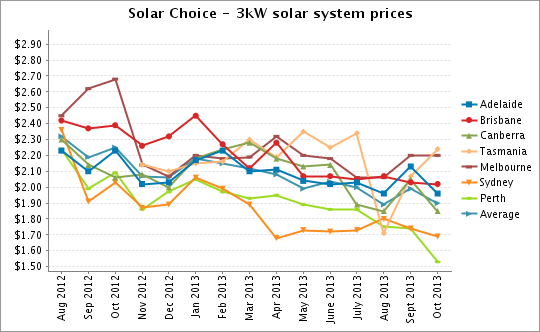
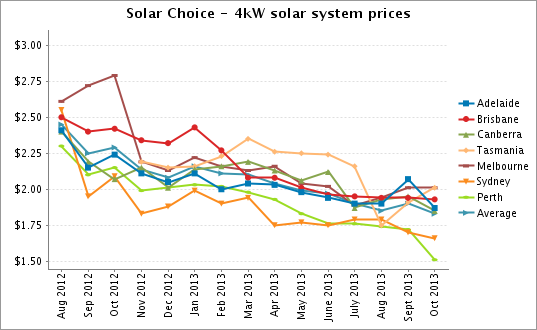
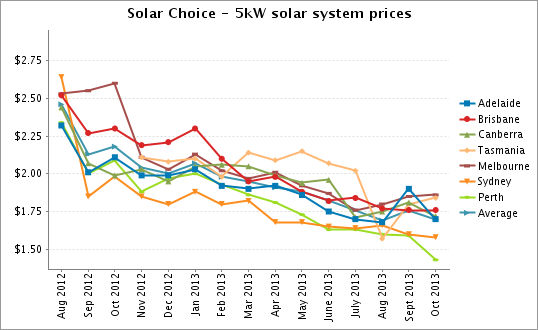
Solar PV system prices dropped notably in Adelaide between September and October, likely as a result of installers addressing new realities in light of the closure of SA’s transitional feed-in tariff to new applicants. Average system prices in Perth also dropped markedly, with all of the least expensive systems (of all sizes 1.5kW-5kW) in the country being found there. Prices appear to have shot up substantially in Tasmania, but the always-small data set means that figures are prone to fluctuation. In a first, 5 out of the 7 areas included in the data (Perth, Sydney, the ACT, Tasmania, and Adelaide) had solar leasing deals on offer.
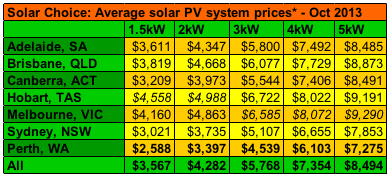
Average prices by solar system size and location
Installer data from every capital city in Australia (excluding Darwin) are incorporated in the monthly Solar PV Price Index. The table below lists average solar system costs for each of these cities (prices for Canberra and and Hobart include all of the ACT and Tasmania, respectively). Perth was home to the least expensive systems in all size ranges. Melbourne was the most expensive.
*Incorporate federal STC discount
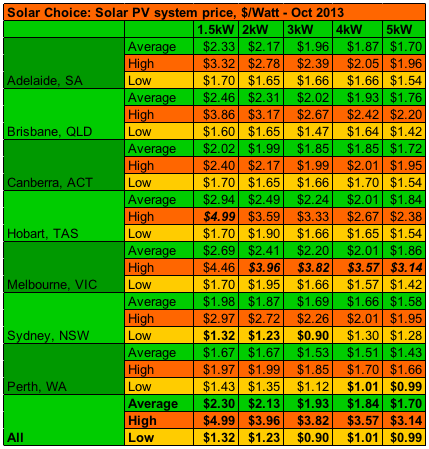
Price-per-watt solar system prices for October 2013: Averages, highs, lows
The below table contains the average, high, and low price per watt for all cities and all 5 system sizes. All prices incorporate the federal government’s STC ‘discount’. The amount of the STC discount is not always explicitly labelled in installer offering data (it is often incorporated as part of a ‘package deal’), but where data was available, STCs reduced up-front system prices by 71c per watt in the Zone 3 cities (Sydney, Perth, Adelaide, and Brisbane). The average STC discount worked out to be 60c/W for Melbourne and Tasmania (Zone 4).
Solar PV system prices to date
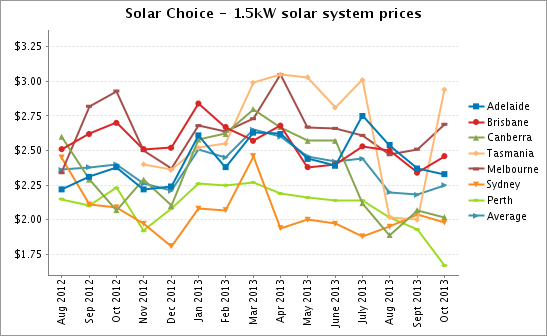
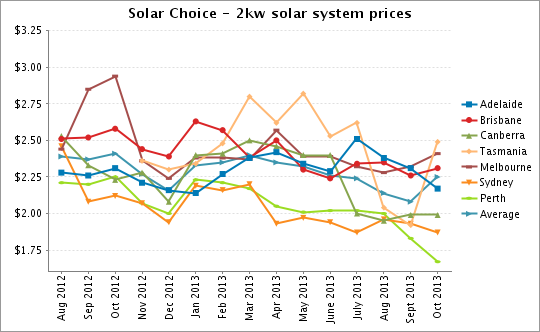
The tables below show historic pricing data since Solar Choice began publishing prices in August 2012. Between this month and last, average 1.5kW-3kW system prices increased in Brisbane and Melbourne. Tasmanian system prices went up across the board, while prices came down significantly for all system sizes in Perth, Adelaide, and (less significantly) Sydney. ACT prices rose for some system sizes, fell for others, but the changes were not significant.
Not included in the charts below are installers offering solar system leasing agreements, which do not incur any up-front capital cost for the homes or businesses that have them installed. Solar leasing deals were being offered in Perth, Sydney, Tasmania, the ACT, and Adelaide.
About this data
Tables and charts included in this article were created using data from Solar Choice’s installer network database, which contains regularly-updated pricing and product details from over 125 solar installation companies across Australia. Prices do not incorporate meter installation fees or additional costs for difficult installations. The discount available to Solar Choice customers is also excluded from the calculations, as are prices for ‘premium’ installer offerings.
About Solar Choice
Solar Choice is a solar PV installation and advice service based in Sydney, NSW, providing free Solar Quote Comparisons for residential solar customers Australia-wide. Solar Choice’s commercial wing, Solar Choice Commercial, manages tenders for medium- to large-scale solar projects for a wide range of clients.
Thank you to Andrew Dunning for pointing out a transcription error in an earlier version of this article.
© 2013 Solar Choice Pty Ltd
- Solar Power Wagga Wagga, NSW – Compare outputs, returns and installers - 13 March, 2025
- Monocrystalline vs Polycrystalline Solar Panels: Busting Myths - 11 November, 2024
- Solar Hot Water System: Everything You Need to Know - 27 February, 2024
