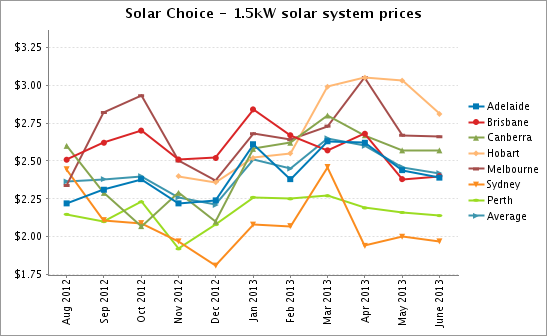
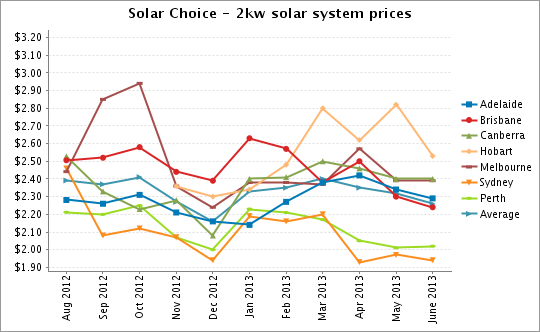
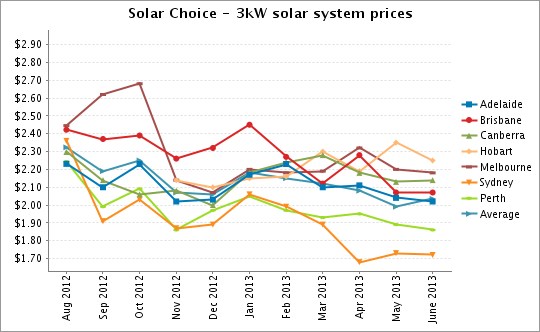
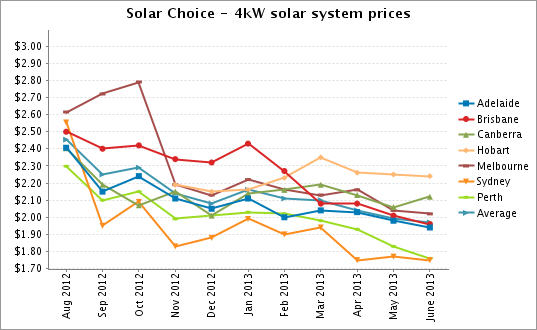
Average solar PV system prices for the 7 Australian cities included in the PV Price Check have more or less held steady since the previous month, May 2013. The June figures nevertheless show price drops in certain cities for systems of certain sizes. Most notably, Hobart solar system prices have come down, to varying degrees, for all sizes (1.5kW-5kW).
Average solar system cost by city and nominal system size
The table below contains the average prices (as of the beginning of June 2013) for solar systems of sizes 1.5kW to 5kW in 7 of Australia’s capital cities. Sydney, in keeping with the trend of the previous several months, continues to be the city with the lowest average installation costs. Perth comes in 2nd place, and Hobart averages remain the highest across the board (although down from last month).
| Solar Choice: Average Solar PV System Prices* – June 2013 | |||||
| 1.5kW | 2kW | 3kW | 4kW | 5kW | |
| Adelaide, SA | $3,652 | $4,587 | $6,004 | $7,659 | $8,702 |
| Brisbane, QLD | $3,697 | $4,533 | $6,233 | $7,812 | $9,069 |
| Canberra, ACT | $3,981 | $4,822 | $6,605 | $8,343 | $9,920 |
| Hobart, TAS | $4,280 | $5,137 | $6,543 | $8,911 | $10,507 |
| Melbourne, VIC | $4,009 | $4,801 | $6,476 | $8,028 | $9,400 |
| Sydney, NSW | $2,990 | $3,881 | $5,190 | $6,982 | $8,195 |
| Perth, WA | $3,235 | $4,080 | $5,525 | $7,110 | $8,227 |
| All | $3,692 | $4,549 | $6,082 | $7,835 | $9,146 |
Solar system prices June 2013: $/Watt averages, highs & lows
The table below contains dollar per watt ($/W) price data for 1.5kW, 2kW, 3kW, 4kW and 5kW solar PV systems in the 7 cities included in the PV Price Index (excluding Darwin). Prices include the federal government’s small-scale technology certificate (STC) subsidy for solar power and other renewable energy generators with a capacity of up to 100kW.
For June 2013, STCs reduced system prices by on average 68c/W (vs 63c/W last month) in Zone 3 cities (Adelaide, Brisbane, Canberra, Sydney, and Perth). Meanwhile, in Zone 4 cities (Hobart, Melbourne), STCs accounted for an effective discount of about 56c/W (up from 53c/W).
STC discount figures have been calculated based on the STC discounts explicitly detailed by installers, when available. Anyone interested in doing so may calculate a rough estimate of the unsubsidised cost of installing a system by adding the appropriate number to the figures in the table below.
| Solar Choice: PV system prices, $/Watt – June 2013 | ||||||
| 1.5kW | 2kW | 3kW | 4kW | 5kW | ||
| Adelaide, SA | Average | $2.39 | $2.29 | $2.02 | $1.94 | $1.75 |
| High | $3.06 | $2.78 | $2.41 | $2.14 | $2.08 | |
| Low | $1.78 | $1.91 | $1.78 | $1.75 | $1.46 | |
| Brisbane, QLD | Average | $2.40 | $2.24 | $2.07 | $1.95 | $1.82 |
| High | $3.13 | $2.85 | $2.67 | $2.25 | $2.20 | |
| Low | $1.78 | $2.91 | $1.78 | $1.75 | $1.60 | |
| Canberra, ACT | Average | $2.57 | $2.40 | $2.14 | $2.12 | $1.96 |
| High | $3.78 | $3.23 | $2.84 | $2.53 | $2.43 | |
| Low | $1.78 | $1.91 | $1.78 | $1.75 | $1.60 | |
| Hobart, TAS | Average | $2.81 | $2.53 | $2.25 | $2.24 | $2.07 |
| High | $3.78 | $3.23 | $2.95 | $2.74 | $2.60 | |
| Low | $2.34 | $2.15 | $1.90 | $1.92 | $1.74 | |
| Melbourne, VIC | Average | $2.66 | $2.39 | $2.18 | $2.02 | $1.87 |
| High | $3.52 | $2.98 | $2.77 | $2.53 | $2.53 | |
| Low | $1.99 | $2.00 | $1.80 | $1.63 | $1.63 | |
| Sydney, NSW | Average | $1.97 | $1.94 | $1.72 | $1.75 | $1.65 |
| High | $2.47 | $2.25 | $1.99 | $2.08 | $1.95 | |
| Low | $1.41 | $1.73 | $1.42 | $1.53 | $1.49 | |
| Perth, WA | Average | $2.14 | $2.02 | $1.86 | $1.76 | $1.63 |
| High | $2.47 | $2.25 | $2.06 | $2.04 | $2.93 | |
| Low | $1.76 | $1.85 | $1.62 | $1.50 | $1.38 | |
| All | Average | $2.42 | $2.26 | $2.04 | $1.97 | $1.82 |
| High | $3.78 | $3.23 | $2.95 | $2.74 | $2.60 | |
| Low | $1.41 | $1.73 | $1.42 | $1.50 | $1.38 | |
Solar PV system prices to date
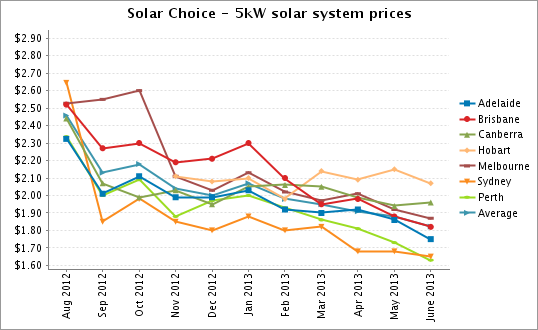
Solar Choice has been compiling data on solar PV prices every month since August 2012. The charts below show the movements in average system prices since that point in time.
The noticeable trends this month are a near flattening out of average prices in every city for 1.5kW, 2kW, 3kW, and 4kW systems. The exceptions are Hobart, where system prices have fallen for all sizes; and 5kW systems, whose prices have fallen in all cities except Canberra. 4kW systems in Canberra also saw a slight price jump.
About this data
The figures and charts in this article were calculated using data from the Solar Choice installer network database, which contains current pricing and product details from over 125 solar installation companies across Australia. Prices do not include meter installation charges or extra charges for difficult installations. The discount available to Solar Choice customers is also excluded from the figures and calculations. Although a range of installer offerings from each city are included in the calculations, average price figures do not incorporate installers’ ‘premium’ offerings.
About Solar Choice
Solar Choice is a solar PV installation and advice service based in Sydney, NSW, providing free Solar Quote Comparisons for residential solar customers Australia-wide. Solar Choice’s commercial wing, Solar Choice Commercial, manages tenders for medium- to large-scale solar projectes for a wide range of clients.
© 2013 Solar Choice Pty Ltd
- Solar Power Wagga Wagga, NSW – Compare outputs, returns and installers - 13 March, 2025
- Monocrystalline vs Polycrystalline Solar Panels: Busting Myths - 11 November, 2024
- Solar Hot Water System: Everything You Need to Know - 27 February, 2024
