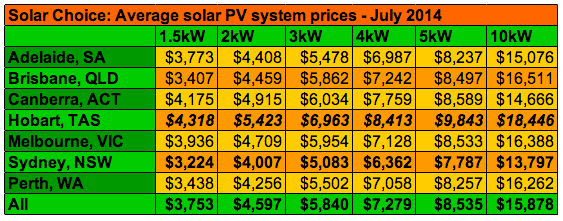
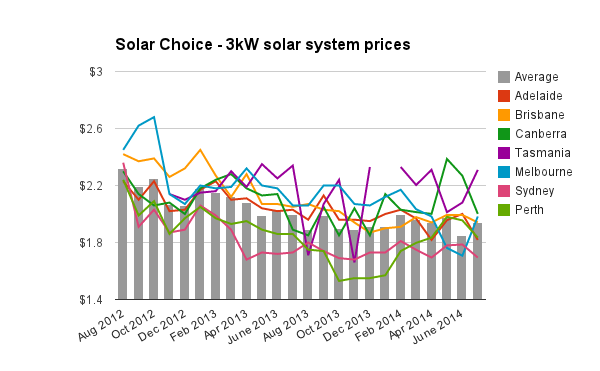
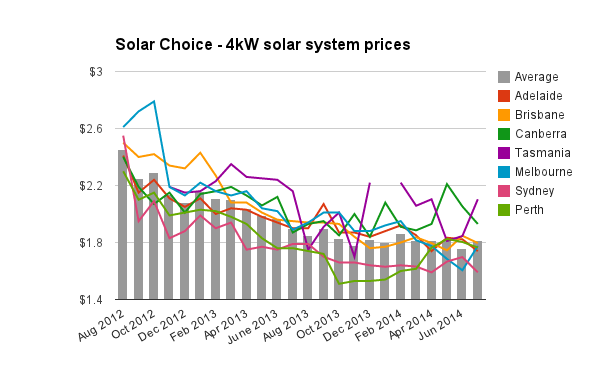
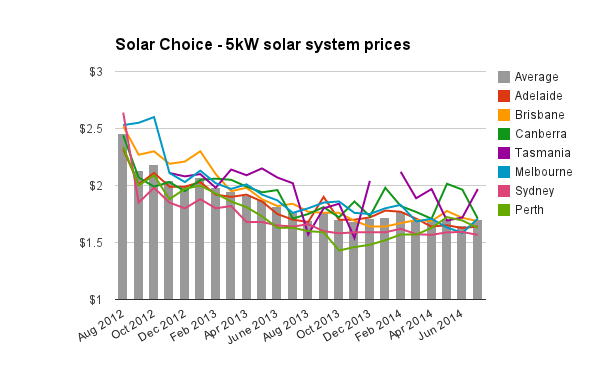
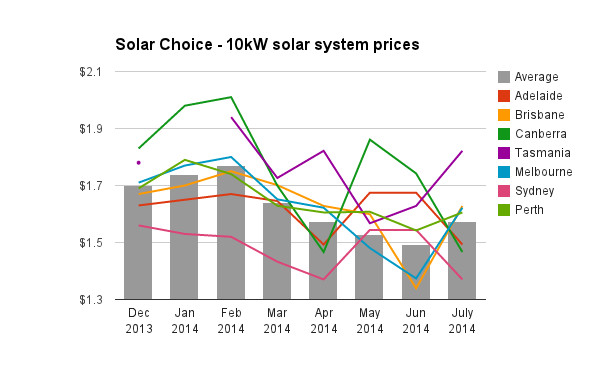
Although higher average system prices in Melbourne and Hobart between this and last month resulted in an apparent increase across all system sizes included in our calculations (except for 1.5kW), the trend in other cities (Adelaide, Canberra, Sydney, Perth & Brisbane) was solidly downwards or flat. Systems were dearest in Tasmania, while Sydney this month pulled ahead of Perth as the leader in affordability.
July 2014 solar PV system prices
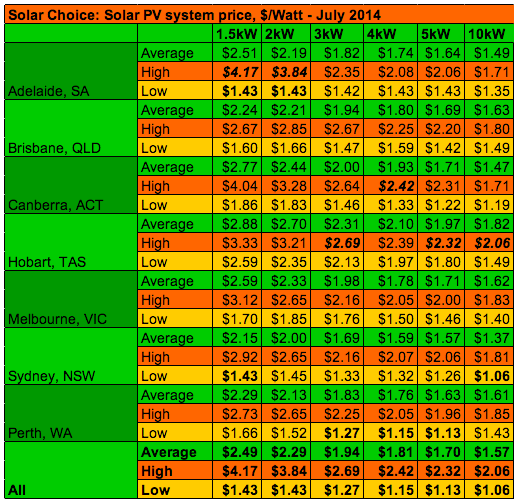
All prices in the table below are inclusive of the federal STC incentive which installers ordinarily include in final system prices.
Solar system prices for July: $/W averages, highs & lows
About STCs
STCs accounted for a price reduction of approximately 69c/W for Zone 3 cities (Sydney, Canberra, Perth, Adelaide, and Brisbane), and around 65c/W for Melbourne & Tasmania.
Components used
The table below contains the brands of inverters and solar modules used in installations as listed by installers. ‘Premium’ offerings are not included.
| City | Panel brands used | Inverter brands used |
| Adelaide, SA | ReneSola, Hanover, Q-Cells, BenQ/AU Optronics, Lightway, Trina, Jinko, Yingli, Munchen, Solar Juice, Yingli |
SolarMax, SMA, Fronius, Growatt, Afore, Samil, JFY, Schneider, Delta |
| Brisbane, QLD | ReneSola, Perlight, Canadian, Yingli, LG, Seraphim, Solar Juice, Jinko | SolarMax, JFY, Eltek, Samil, Xantrex/Schneider, Zever, Fronius, SMA |
| Canberra, ACT | ReneSola, Q-Cells, Phoenix, Jinko, Yingli, Trina | JFY, Growatt, Fronius, Power-One Aurora, SMA |
| Melbourne, VIC | Trina, ReneSola, SolarWorld, Yingli, Lightway, Jinko, Solar Juice, BenQ/AU Optronics | Power-One Aurora, Fronius, SMA, Samil, SolarMax, Latronics |
| Tasmania | Jinko, ReneSola, Yingli, Trina, Solar Juice | Fronius, Power-One Aurora, SolarMax, SMA, Growatt, Samil |
| Sydney, NSW | ReneSola, Trina, Munchen, Top Solar, Jinko, Q-Cells, Canadian Solar, Yingli, Solar Juice | Power-One Aurora, SolarMax, Fronius, JFY, Eversolar, SMA, Samil |
| Perth, WA | GY, Jinko, ReneSola, Opal, Trina, Solar Juice | JFY, Growatt, SMA, Power-One Aurora, Fronius, Samil, Delta |
Historic solar PV system prices (since August 2012)
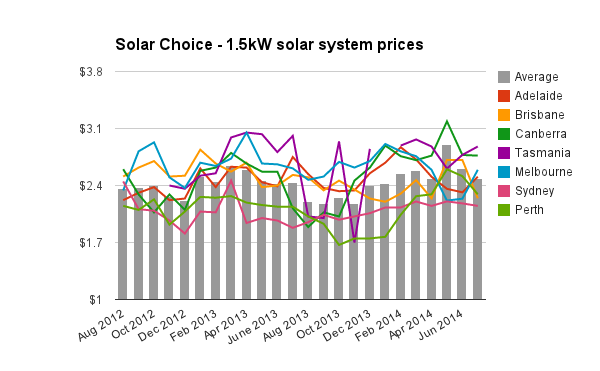
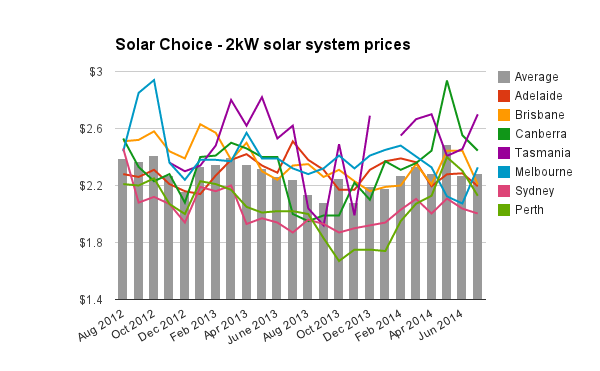
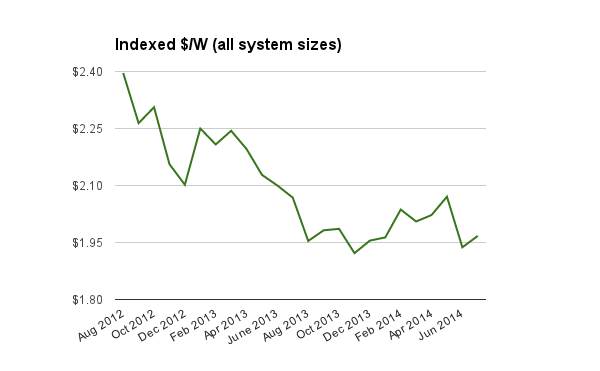
Indexed $/W solar system prices (Historic)
The chart below provides an at-a-glance look at solar PV system pricing trends since August 2012. Data points are the average of average $/W for each system size (1.5kW-5kW until Nov 2013, then also including 10kW from Dec 2013).
About this data
Tables and charts included in this article were compiled using data from Solar Choice’s installer network database, which contains regularly-updated pricing and product details from over 125 solar installation companies across Australia. Prices do not ordinarily incorporate meter installation fees or additional costs for difficult installations. The discount available to Solar Choice customers is also excluded from calculations, as are prices for ‘premium’ installer offerings. Except in the final chart, average pricing figures for all of Australia are not weighted.
About Solar Choice
Solar Choice is a solar PV installation and advice service based in Sydney, NSW, providing free Solar Quote Comparisons for residential solar customers Australia-wide. Solar Choice’s commercial wing, Solar Choice Commercial, manages tenders for medium- to large-scale solar projects for a wide range of clients. Solar Choice also develops large-scale and utility-scale solar projects of its own.
© 2014 Solar Choice Pty Ltd
Hello,
I’m doing a little bit of work on the affordability of PV systems and the price trends in Australia over the last couple of years. Can you tell me if the average prices you have on your Price Index represent the average price for each state, or just for the capital cities?
Thank you for your help,
Sharon
Hi Sharon,
At this point in time the prices are reflective only of installer offerings in Australia’s capital cities (excluding Darwin) and all of Tasmania. If an installer charges a travel fee to areas outside these cities, it is not included in our calculations.
Hope this is helpful for you.