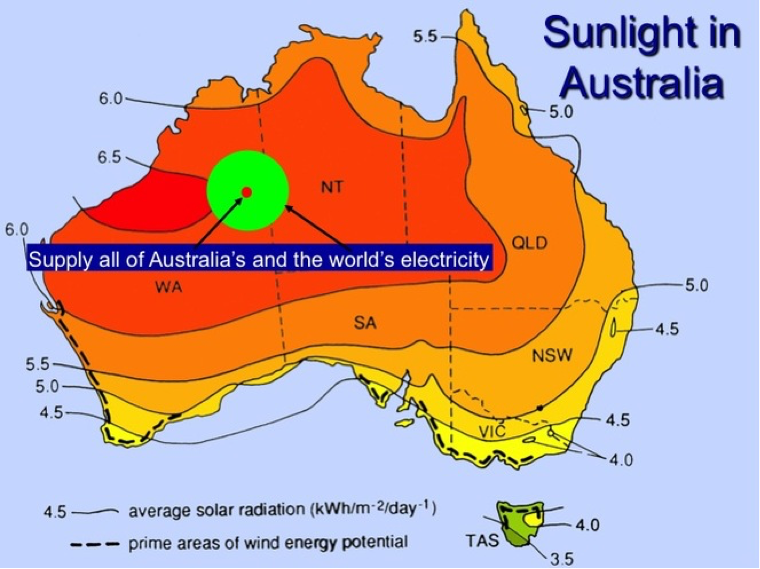
In the first part of this series, we outlined the enormous potential for Australia to become a solar energy exporter for the southeast Asia region. In fact, we are so blessed with solar energy that we receive enough to feed our domestic electricity demand more than a thousand times over.
There are however significant challenges when ‘putting all your eggs in one basket’ and establishing just one large solar farm in the middle of the outback to supply all domestic demand. The generated electricity must somehow be transported to the areas where it’s used. This centralised structure seems impractical and unlikely to be the best available option. So what if we changed our approach and distributed that giant outback solar farm all over the country to the capital cities which need it most?
This latest installment goes ones step further and outlines the potential to change Australia into a low carbon economy from within our own backyards. The ‘solar potential’ of our major cities is evaluated in the data presented below. How far can solar PV take us towards being a 100% renewable economy? According to the figures, very far indeed.
The analysis simplifies the total electricity demand of each Australian capital city as a weighted average based on each city’s population. For example, the population of Sydney is placed at 4,757,083 residents (as of 2013). With the Australian population projected at just over 23,000,000 and an annual electricity demand of 261 terrawatt-hours (TWh), this analysis has allocated a population-weighted annual electricity demand of 53.68 TWh for Sydney. A similar approach was used for all other major cities.
The next step approximates the total area of each city that would need to be covered with solar panels in order to supply the population-weighted electricity demand and present it as a percentage of each city’s total area.
The table at the bottom of the article outlines the findings.
The numbers are astounding. Our four largest capital cities, which account for over 13 million residents, could (on average) generate as much electricity as they consume by utilising at most 2% of their total metropolitan area for solar energy production. This total area could include both rooftop systems – possibly accounting for a majority of the required capacity – and larger ground-mounted solar farms which utilise unused or idle land. That free energy is there for the taking and it is right under our noses.
And with the rapid advancement of batteries and other storage technologies, the business case for such a radical redesign of our electricity networks will grow even stronger.
The figures presented above have simplified many of the practical issues regarding the operation of our modern electricity networks and are purely indicative. Regardless, the numbers prove there is enormous potential for PV technology being the dominant energy source in our sunburnt country. The common misconception of solar panels not being efficient enough to supply our electricity needs are simply not true. We have the tools and natural resources available to enable an energy revolution.
| Sydney | Melbourne | Brisbane | Perth | Adelaide | ACT | Hobart | Darwin | |
| Area (km2) | 12,368 | 9,991 | 15,826 | 6,418 | 1,827 | 2,280 | 1,696 | 112 |
| Population | 4,757,083 | 4,442,918 | 2,238,394 | 1,972,358 | 1,291,666 | 385,600 | 217,973 | 146,245 |
| Peak-Sun Hours | 5 | 4.5 | 5 | 5 | 4.5 | 5 | 4 | 5.5 |
| Population-Weighted Annual Electricity Demand (TWh) | 53.68 | 50.13 | 25.26 | 22.26 | 14.58 | 4.35 | 2.46 | 1.65 |
| Area Required (km2) | 196 | 203 | 92 | 81 | 59 | 16 | 11 | 5 |
| Percentage of City | 1.6% | 2.0% | 0.6% | 1.3% | 3.2% | 0.7% | 0.7% | 4.9% |
The calculations above were based on an Australian population of 23,130,000, a national annual electricity demand of 261 TWh and a conservative average module efficiency of 15%.
Top Image Credit: The Conversation
