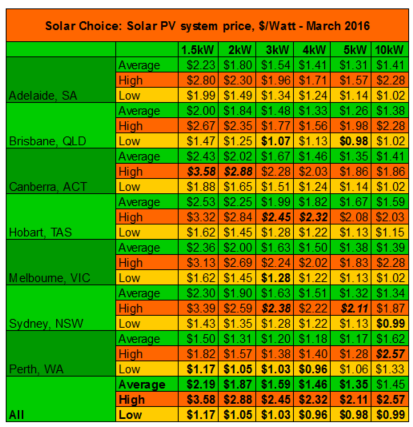
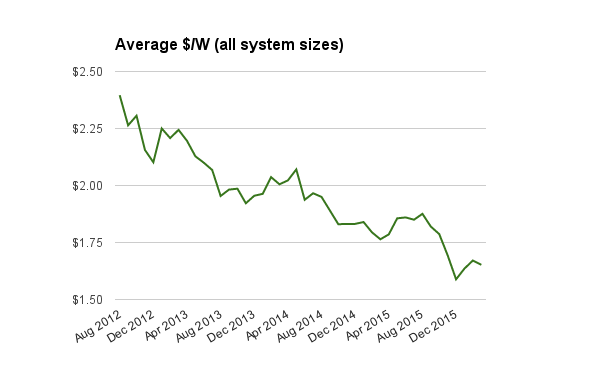
After two consecutive months of increases, average solar PV system prices have dropped slightly for the first time in the new year, currently sitting at about $1.65/W.
Average solar PV system prices for March 2016
Prices in the table below are net of the federal Renewable Energy Target’s STC incentive and include GST.
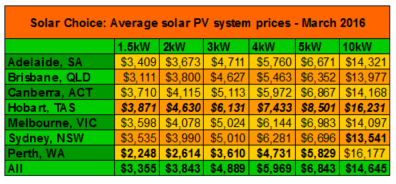 Solar system prices for March: $/W averages, highs & lows
About STCs
STCs accounted for a price reduction of approximately 68c/W for Zone 3 cities (Sydney, Canberra, Perth, Adelaide, and Brisbane), and around 58c/W for Melbourne & Tasmania.
Historic solar PV system prices (since August 2012)
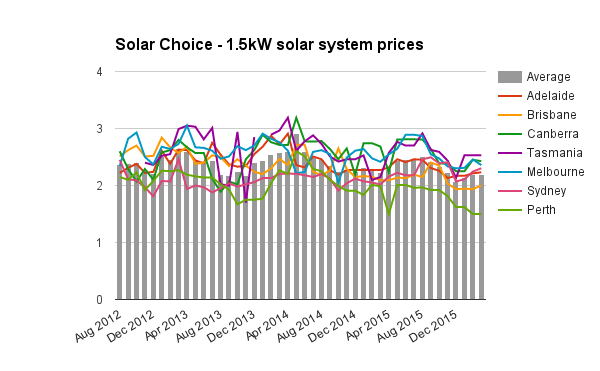
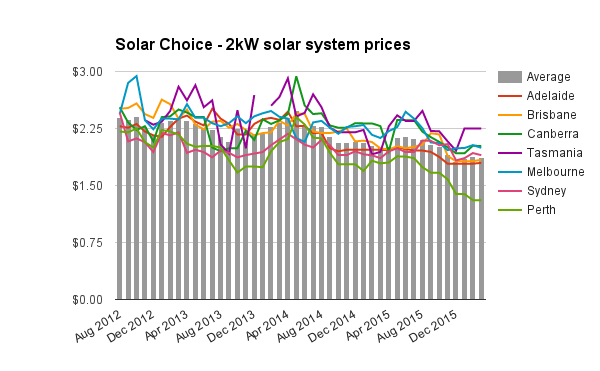
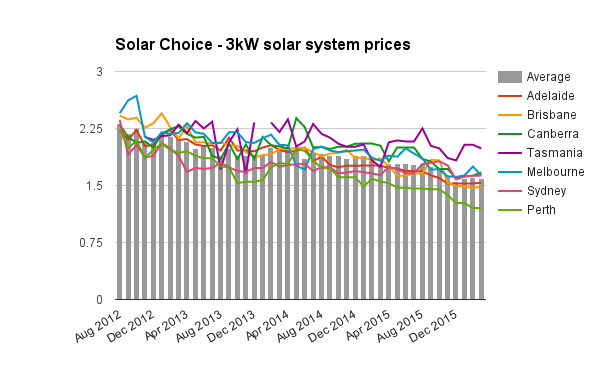
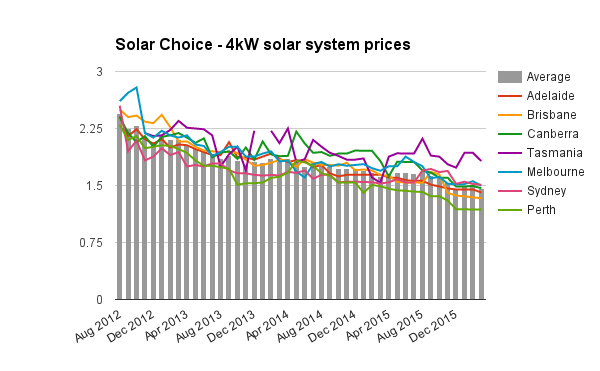
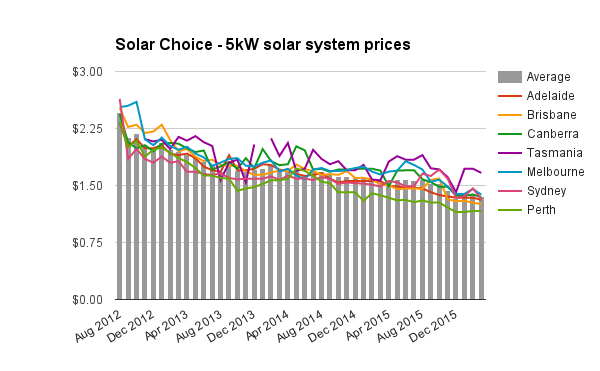
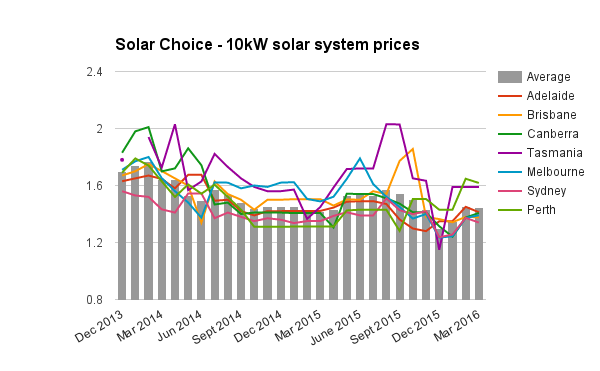 All $/W solar system prices (Historic)
The chart below provides an at-a-glance look at solar PV system pricing trends since August 2012. Data points are the average of average $/W for each system size (1.5kW-5kW until Nov 2013, then also including 10kW from Dec 2013).
 A note about the ‘Solar Choice discount’
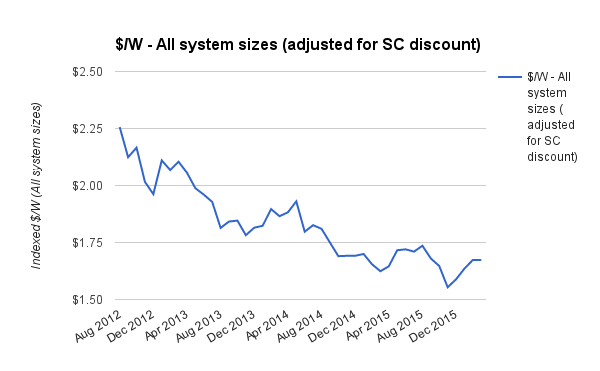
From August 2012 until November 2015, calculations for our monthly Residential Solar Price Index articles excluded the discount available through Solar Choice network installers exclusively to Solar Choice customers. From last month we have excluded this figure, which works out to approximately 14c/W in most instances. The chart below retroactively applies this amount to every month since the Price Index’s inception.
 About this data
Tables and charts included in this article were compiled using data from Solar Choice’s installer network database, which contains regularly-updated pricing and product details from over 100 solar installation companies across Australia. Prices do not ordinarily incorporate meter installation fees or additional costs for difficult installations. The discount available to Solar Choice customers is also excluded from calculations, as are prices for ‘premium’ installer offerings. Except in the final chart, average pricing figures for all of Australia are not weighted.
© 2016 Solar Choice Pty Ltd
