Getting the most of your solar system – and generally keeping your electricity bill manageable – means knowing how to time your energy use appropriately throughout the day. For most Australian solar households, this means focusing on solar self-consumption – using as much solar energy during daylight hours as possible.
The amount and timing of sunlight available varies significantly with the seasons, however. In winter, for example, the ‘solar window’ is a bit shorter and peak power output from a solar system tends to be less than in the summer months.
There’s an additional layer of complexity if you’re on time of use (TOU) electricity billing (as opposed to a flat, ‘anytime’ rate). Namely, you’ll have the option to save more money by running certain devices (like dishwashers, washing machines & water heaters) overnight, when cheap, ‘off-peak’ rates are in effect. This practice is known as ‘load shifting‘, and should be a key part of any savvy household’s energy saving strategy.
If you’re on top of your energy consumption habits, this may seem easy to remember, even as the seasons change. But even if you are, the details are much more likely to stick in your mind if you see them every time you pass your refrigerator.
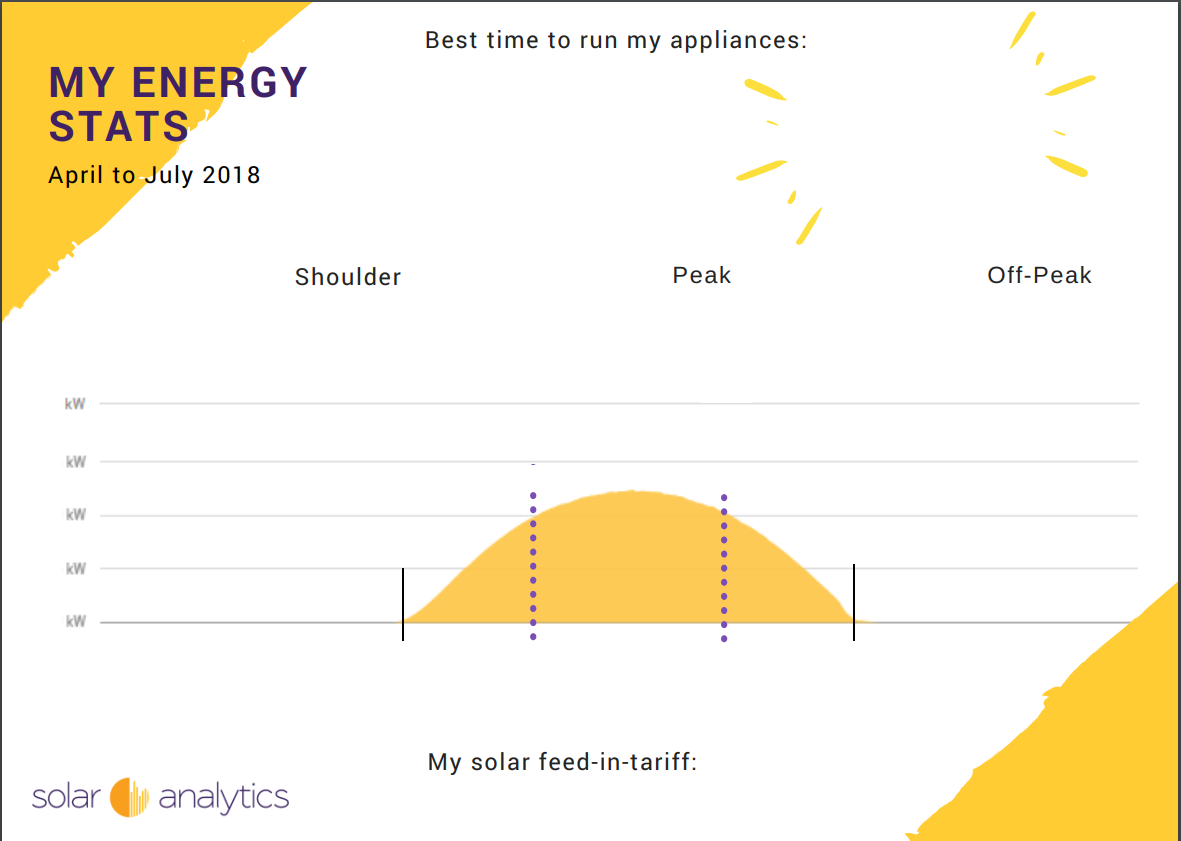
A blank version of the My Energy Stats chart – to be filled out by the household using it. See below for example chart.
This is exactly why Solar Analytics has developed a handy, printable ‘My Energy Stats’ chart (below). If you’ve got a solar monitoring system (such as Solar Analytics) in place, deciphering when when your solar PV system ‘kicks on’ in the morning, reaches peak output (in kilowatts) in late morning-early morning, and ‘shuts down’ in the late afternoon should be easy (and even if you don’t, it should be relatively easy to guess). You can then mark down these times – along with your electricity rates at various times of day (if you’re not on a flat rate) – on the sheet for future reference.
You can download a printable PDF version of Solar Analytics’ My Energy Stats chart here.
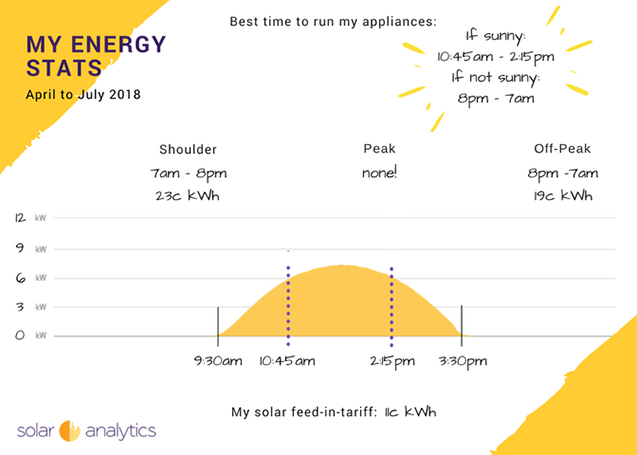
An example of how to fill out the My Energy Stats chart. Note that figures will depend on your location, solar system size and electricity tariff type.
Compare Solar & Battery Quotes
- Running Cost of Air Conditioners – Explained - 7 October, 2025
- Air Conditioner Rebate South Australia: What You Need to Know - 19 September, 2025
- Air Conditioner Rebates in Queensland: What You Need to Know - 19 September, 2025

