Anyone who has done some investigation into having solar panels installed in Australia should by now understand that the whole endeavour only makes economic sense if the home in question ‘self-consumes’ as much of that solar power as possible. Solar feed-in tariff incentives having dried up in every state, the business case for going solar is now based on how much of their ordinary electricity usage that a home can source from their solar panels directly as opposed to purchasing it from the grid. The status quo basically calls for solar homes to try to be as energy self-sufficient as possible to make the most of their investment.
(Part 2 of this series looks at household electricity patterns.)
Paul McArdle of WattClarity recently brought up some interesting points on this topic when he took a look at ‘the buzz about solar PV‘. In his writing he makes reference to a talk given by Mike Swanson of Queensland utility Energex at an event called “Energy in 2014: More mines than field“. Among the graphs that Mr Swanson showed during this talk were 2 that tell a story, and although the exact details of that story are not yet fulling clear, the fact that distributed rooftop solar PV is having a major impact on the electricity industry is unquestionable.
Rooftop solar now comprises 5% of Australia’s electricity generation capacity. According to industry analysts SunWiz, 41-42% of suitable homes in Queensland and South Australia already have solar panels; in the other states, this percentage ranges from 13%-31%–still significant.
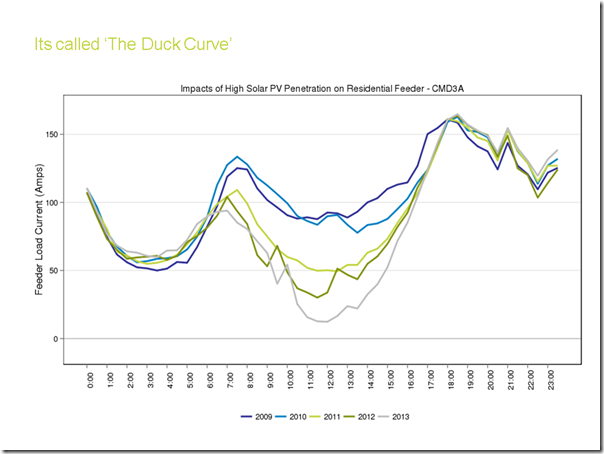
The chart below offers a glimpse into how all this capacity has affected Australia’s electricity market. More specifically, it shows how solar has helped to shave off daytime electricity demand, generally meaning that less conventional, fossil fuel-fired generation needs to be brought online to ensure the supply-demand balance is met.
Solar homes vs energy efficient homes: Who saves more?
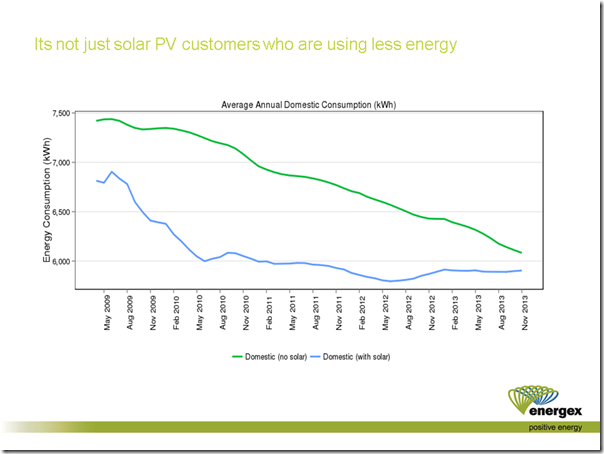
But, as Mr McArdle notes, the role of solar PV may only be part of what’s going on, with the full story being more complex. The next graph illustrates how electricity consumption patterns between solar households and non-solar households compare with one another. Namely, it shows a relatively sharp drop in electricity consumption among solar households, while non-solar households seem to be reducing their consumption more gradually.
 WattClarity offers up a few possible explanations for these trends. The solar situation seems relatively clear: greater, ‘behind the meter’ self-consumption of solar power means less of a need to purchase power from the electricity grid. The non-solar household situation is most likely a story of gradual energy efficiency improvements (e.g. replacing old appliances & installing insulation) combined with skyrocketing electricity prices (prompting consumers to try to use less) would seem to be the driving forces behind falling demand in these cases. What seems obvious is the fact that solar homes have greater potential for reducing their electricity bills–especially if they minimise their grid electricity consumption and maximise their solar power consumption.
Important considerations for current and future solar system owners
(Skip to the bottom for a summary checklist)
In addition to the thought-provoking ‘Questions for policy designers’ that Mr McArdle includes at the end of his article, these graphs also prompt some very pertinent and important questions for would-be and current solar system owners, mainly with regard to how they choose their system’s size and how they use the power it produces once installed. The chart above clearly demonstrates that electricity usage for system owners is not descending on the same slope as non-solar homes. Could it be that these homes, already witnessing significant bill reductions (thanks mainly to the generous feed-in tariff incentives that many of them receive), become so lax as to cease pursuing any additional measures to reduce their power bills? In such cases, there should be even more of an opportunity for more savings and grid-independence.
Choose your solar system size wisely
As the International Energy Association (IEA) and Australian solar industry analysts SunWiz have pointed out, the average size of a solar system in Australia has grown significantly in recent years, thanks primarily to the increasing affordability of solar technology. Whereas 4 years ago most homes were opting for 1.5kW systems, nowadays the average size is between 4kW and 5kW for the nation as a whole. But how does any one household know if it’s choosing the appropriate system size?
Determine your daytime electricity requirements
These days, appropriately sizing your solar system is all about understanding how much electricity you use during daylight hours–you want to make sure you consume as much of your solar power as possible. If you look at your quarterly electricity bill you can easily get some idea of your overall daily usage (i.e. daylight & after-dark hours, usually around 20kWh/day for most 3-person homes) but discerning a higher level of detail is more difficult without taking inventory of which appliances use how much power and at what time throughout the day. This is a great option if you have the time and the means and plan on managing your usage in detail. Some solar installation companies may also help you to work this out in preliminary consultations.
A slightly easier (but less accurate) way to estimate daylight usage would be to come up with a percentage of daylight vs nighttime electricity usage. If, for example, you use around 20kWh in total on a daily basis, divide your appliances into 3 categories based on current usage: ‘Always on’, ‘on during the daytime’, and ‘on at night’. How many devices do you have in each category? How much usage from the post-sunset hours be shifted to daytime? Add up those from the first 2 categories and divide by the total to get a percentage, which you can then multiply by your total daily usage to get a (very rough) idea of what your daytime energy usage is. For example: 15 daytime & always on devices divided by 20 total devices equals 0.75, and 0.75 x 20kWh = about 15kWh. (Please note that this method is not exact, and will only yield a ballpark figure.)
Determine what system would best meet these daytime requirements
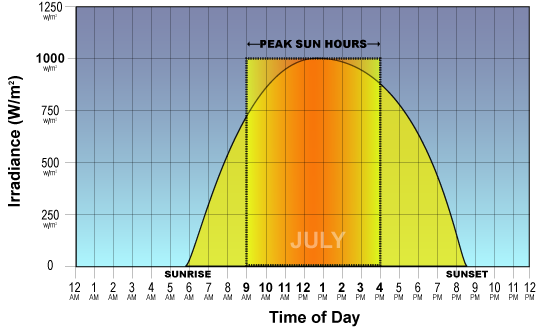
Depending on the amount of daily sunlight your region gets on average throughout the year, the system size that will best meet your demand will vary. If you live in Brisbane, for example, you can count on about 6.2 ‘peak sun hours’ (PSH) daily (more in summer, less in winter). Because 1kW of solar capacity in Brisbane will generate (1kW x 6.2PSH =) 6.2kWh, a 5kW system would generate around (5kW x 6.2PSH =) 31kWh of solar power–clearly too much for the home in our case study above which uses 15kWh during the day.
Example of solar intensity and peak sun hours (PSH) throughout the day. (Image via JS Solar.)
Since the excess solar energy will automatically be sold into the grid at a nominal rate (about 8¢/kWh) as opposed to saving you 25¢/kWh or more in avoided electricity purchase, solar homes should endeavour to use all of the solar electricity themselves. A more appropriately-sized system might be more in the range of 3kW in capacity, as 3kW x 6.2PSH equals around 18kWh. Slightly smaller would be even better, to avoid ‘leakage’.
Take electricity consumption into your own hands
For many households, thinking about and acting on high electricity bills is likely to stop with the installation of their system. But for the home that is serious about getting the absolute most out of their solar panels, there’s plenty more to be done. Electricity consumption levels and timing are not fixed. In fact, electricity consumption is something over which a home’s occupants can actually exercise a large degree of control, either by increasing vigilance about not leaving unused devices on or plugged in, by improving insulation in the home, or by replacing old devices with newer, more energy-efficient ones. (Getting a home energy audit is a great place to start.)
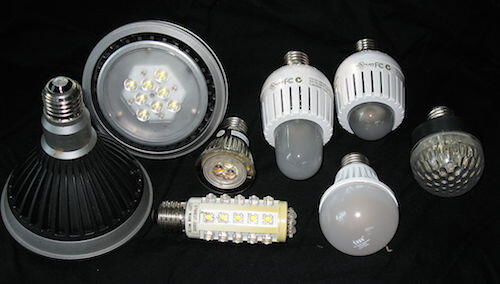
Ultra-efficiency (and increasingly affordable) LED light globes are one way that homes can reduce their electricity consumption. (Image via Wikipedia.)
The green line in the second chart above demonstrates fairly clearly that electricity consumption levels (and therefore bills) can be cut even without solar. But with solar, the potential for savings is multiplied: if a solar home managed to shift as much of its It’s not clear whether the solar households represented by the blue line have already taken energy efficiency measures, but assuming they have not (undoubtedly the case for many), the situation gets slightly more complicated and interesting as we enter the more nebulous realm of the hypothetical.
If a solar system is sized to meet the daytime electricity demand of a house, and then that demand declines thanks to steps taken to reduce consumption, the system owner will end up sending more electricity into the grid. While this will earn credits for the system owner on their electricity bill, at this point these credits (at around 8¢/kWh) are quite meagre considering solar’s ‘offset value’ (25¢/kWh or whatever the cost of grid electricity is). While this may look like a ‘loss’, it would still result in a smaller power bill provided the energy consumption reductions don’t require much capital outlay. Less electricity consumed is less electricity purchased and a bigger credit on the power bill.
By all means, homes should aim to reduce their electricity consumption both before and after going solar. But this brings us back to the importance of appropriate solar system sizing: To undersize is to err on the side of caution, as long as a household isn’t expecting to increase power usage in the near future (due to, for example, an addition to the home or the family that lives in it).
Monitor your solar system’s productivity
The term ‘prosumer‘ (producer-consumer) has become something of a buzzword in the electricity industry in the past several years. In addition to the ‘producer’ aspect, the term also denotes a tendency to be proactive in controlling consumption habits to ensure they’re saving the most money possible. The prosumer is differentiated from ordinary consumers, who are passive and make no effort to change their habits to save money. As more homes invest in solar systems and grow increasingly disgruntled at rising retail electricity rates, the number electricity prosumers grows.
The most vigilant prosumers will not only monitor and police their own electricity usage, they’ll also have a good idea of how much power their solar system produces and adapt their behaviour accordingly. There are countless tools available for this purpose, many of which allow remote monitoring. Most inverter manufacturers these days even build monitoring capability into their devices, or offer them as easy add-ons. Some companies (such as Sun Monitoz, Solar Analytics and Onyx Solar) offer complementary solutions which will give system owners a clearer idea of what their system should ideally be producing compared to what is in fact producing.
Checklist: How to get the most from your solar panels
To summarise the above points into 4 bullets:
- Choose your system size wisely by knowing your electricity usage levels and behaviour
- Know your devices and when to use them–which devices use how much power?
- Take your electricity consumption into your own hands–be proactive in reducing consumption by replacing inefficient devices, shutting off devices not in use, and shifting as much of your consumption to the daytime hours as possible
- Monitor your system’s output so that you know when to use electricity–and how much to use
© 2014 Solar Choice Pty Ltd
- Solar Power Wagga Wagga, NSW – Compare outputs, returns and installers - 13 March, 2025
- Monocrystalline vs Polycrystalline Solar Panels: Busting Myths - 11 November, 2024
- Solar Hot Water System: Everything You Need to Know - 27 February, 2024


Hi,
Thanks for the information, it is helpful.
How do I switch from a gross feed-in tariff to a net feed-in tariff?
My latest electricity bill for 96 days shows the following:
Peak 1293 kWh at 23.26 c/kWh
T31 night 468 kWh at 14.42 c/kWh
Total usage = 1761 kWh
Solar feed-in 971 export kWh at 6 c/kWh
Solar meter charge at 6.26 c/day
As you can see from the figures above, I’ll be better off with a net feed-in tariff.
I have a 4 kW system. I live in Brisbane. I’m with Origin.
Regards
Pas
Hi,
I have worked it out. I thought I was on a gross feed-in tariff, but it turns out that I’m on a net feed-in tariff.
The Solar feed-in 971 kWh exported turns out to be the excess electricity not used during the day that was feed back in to the grid.
Regards
Pas
We have a net metering system. We lose unused credits after a year. We were fortunate enough to have a sunny Nov. and now are going to lose $110 to the power company this coming month. Would it make sense to use power sucking appliances during the dark hours to cut into the credit?
Hi Susan,
The answer is probably yes. Assuming you’re in NSW, our article about options for dealing with the reduction of the solar feed-in tariff at the end of this year would probably be helpful. It may even be helpful if you’re in a different state with a low feed-in tariff (which is most of them these days).
Hi, i have a 2kw solar system that is great during the summer. My inverter display shows the system is generating nearly 2000w during the peak of the day. Just that is winter now and my inverter shows only around 400w. I use a fair amount of power during the winter for heating. Is there a way in which i can keep my 2kw inverter an add more pannels to the system to allow for the winter months? Once summer is back i would not mind if these extra panels were switched off.
Thanks
Mick
Hi Mick,
Before you think about adding extra panels you may want to check if your roof is getting any shading from nearby objects during the winter months (more likely than summer as the sun is lower in the sky). Your system’s peak output shouldn’t be that different between summer and winter unless the tilt & orientation of the panels is way off (e.g. they face east or west and/or are flat/nearly horizontal).
I’m assuming that your panels are north-facing, which means that shading is likely an issue in the winter – but I recommend that you get in touch with a certified installer to discuss the situation in detail.
Best of luck!
Hi, I am in South Australia and getting 0.52c for my solar. We are a high user of power as we have a swimming pool and ducted reverse cycle air conditioner so is it best to use our power during the day or at night? We are on a single tariff electricity account.
Regards Graham
Hi Graham,
If you’re on a single-tariff account (presumably paying 25-30c/kWh) and you’re getting 52c/kWh for your solar, it makes more sense for you to export your solar than to self-consume it – therefore it’s better if you use more power at night.
To clarify the maths: If you self-consume the solar in your current situation, you’ll save 25c/kWh (if that’s the rate that you pay), whereas if you export your solar you’ll get a credit of 52c/kWh – so basically you’ll be about 27c better off for each kWh of solar you send into the grid.
Hope this helps!
Hi, can you tell me, we are installing a 5kw solar system when am I best to use the electricity is it best to use it during the day when we are making it? Thank you
Hi Kerry,
With no access to a generous solar feed-in tariff, the best way for any home in Australia to get the most out of their solar system is to consume the solar energy as it is being produced – during daylight hours. So yes, makes sure that you are using the energy during the daytime.
Alternatively, you can consider installing a battery storage system to ‘soak up’ your excess electricity during the day for later use at night. However, this will add to the cost of your system and make your total its payback time longer.
Hope this helps!
For our household we have been fortunate to receive a generous export rate of 52cents (44 plus 8 from the retailer). We got in just before the Qld govt ended the offer.
We have a 5 kw solar system.
We pay 22.85 cents per kwh.
For us it is better to use as little power as possible during daylight and therefore export the maximum possible and be paid 52c per kwh.
What we use at night costs 22.85 per kwh.
On the last bill (quarterly) which is for spring and dated 01.12.15 we bought 1024Kwh and exported 1521Kwh. We received a credit of
$ 471. We borrowed to pay for the installation.
In Qld there is currently a lot of complaint about those without solar paying more because of those with it. How much has been saved possibly because the State does need extra generating capacity, due to roof top solar panels?
Hi David,
The massive uptake across Australia has definitely had an impact on electricity demand trends (and for the better), but there has not been a definitive, comprehensive analysis done about how the benefits stack up against the costs. There’s also the question of how the benefits and costs could be quantified – I’m sure those on both sides of the argument would interpret things differently.
What’s missing from all posts I’ve been able to find:-
1.Regional seasonal and annual aggregate daylight Kwh. generated per solar panel Sq.M.
2. Above at best and worst energy efficiency ranges.
3. Consumption checklist of typical Kw. ratings for common household appliances e.g. washing machines, dishwasher, vacuum, A/c unit, radio, TV, oven, etc.
From item 3 we calculate savings and from 1 minus 3 we calculate feedback revenue.
Without above info it’s not possible to make an intelligent assessment of solar savings. Where can I find all this?
Hi Jon,
You bring up some interesting and relevant points. We do have some articles that directly and indirectly address these to greater or lesser degrees, but seldom get anyone asking for them in one place.
We may not have aggregate seasonal kWh/kW numbers, but we do often write in terms of average annual daily generation (i.e. the annual production divided by 365). We feel that this number is more useful than ‘kWh generated per solar panel’ because solar panel specs and efficiencies vary significantly; talking about a 2kW solar system is more useful than talking about 8x 250W solar panels.
As far as consumption is concerned, this is a good point and we will work on integrating some information on this topic into the site – at the moment there are mentions of appliance usage but nothing comprehensive or akin to a case study. Nevertheless, it is still possible for households to get a rough picture of how much a solar system will enable them to offset by looking at their overall electricity usage for a quarter.
The biggest piece you are missing at the moment is your own consumption patterns, times and levels – you should be able to figure these out by looking at the labels on your appliances and estimating how many hours per day or per season that you use them. Alternatively, you can invest in some socket-level electricity meters to keep more detailed track of your consumption.
Hope this helps, and thanks for the valuable feedback!
Hi,
we are getting a solar feed in tariff of 60 cents.
My question is should the washing machine, dryer, etc. be used during the day (if it’s sunny) or during the off-peal electricity times?
Thank you.
Our article is written mainly for solar homes who are on a net feed-in tariff (where you get paid only for excess solar power that you export to the grid) as opposed to a gross feed-in tariff (where all of your solar power is exported to the grid). NSW’s 60c/kWh Solar Bonus Scheme is a gross feed-in tariff arrangement, so in your case it will make little difference when you use your electricity unless you are on a time-of-use electricity tariff rate (where electricity prices are higher during the evening ‘peak’ and lower during other off-peak times).
I hope this clarifies things. Please let me know if it doesn’t.
Thanks for the information.
Please let me know what would be the correct system for our property. Having read as much as I can is it around 3kW or should I go to a 4 kW system
According to our electricity bill our average daily use is 19.42 kWh.
Comprised as follows
Basic-Home peak consumption – Block 1 (10.95891 kWh/day)^
Basic-Home peak consumption – Block 2 (2.69374 kWh/day)^
Basic-Home dedicated Circuit
consumption (5.76842 kWh/day)v
You estimate would be helpful. I live in Sydney
Thanks
Larni Kelleher
Hi Larni,
Because solar feed-in tariffs are virtually non-existent for newly installed solar systems these days, it’s best to have a system that will produce only enough electricity to meet your daytime needs. You don’t want a system that is too large, because your excess electricity will go into the grid and be effectively ‘wasted’, netting you only about 6-8c/kWh as opposed saving you 25c/kWh or so in avoided electricity costs (when you consume your solar power yourself).
Solar panels won’t produce electricity when the sun isn’t shining, of course. This means that you have to make an informed guess as to what portion of your total daily electricity consumption happens during the day. If you assume you use about 50% of your electricity during daytime hours, then you should size your system to meet half of your average daily electricity needs – 19.42kWh x 0.5 = 9.71kWh per day. Assuming that every kilowatt of solar capacity in Sydney produces about 3.8kWh of electricity, you can calculate backwards to get (9.71kWh / 3.8kWh/kW =) 2.5kW. You could round this down or up to 2kW or 3kW. A 4kW solar system would likely be too large for your needs.
If you’re interested in comparing solar quotes from numerous solar installers who operate in your area, please fill out our Solar Quote Comparison Request form. Our services are 100% free to our customers.
Thanks for the information!
We’ve had a huge number of solar companies door knocking trying to sign us up with a 2.5kw or 4kw system and they claim their 2.5 or 4kw is perfect for a family home.
Going by your information we would realistically need the 10kw system.
I think there is going to be a lot of disappointed people in our area who signed up to the small kw solar deals without looking into what they realistically needed.
Thanks, Stacey. Glad you found it helpful!
And keep your Panels Clean!!