When it comes to choosing batteries for home or commercial battery storage, it can be difficult to sift through the multitude of options to find the IDEAL battery for your application. The options range from different operating voltages, amp-hour (Ah) storage capacities, sizes, weights, brands and – to make things even more complicated – different battery chemistries.
What is most important, however, is that the chosen model(s) provides electricity to the site when needed – either for regular use, time shifting or as a back-up supply – and at the best value price. This article discusses important issues surrounding effective cost comparisons between different battery technologies – technologies which can vary greatly in a number of important performance characteristics such as nominal cycle lifetime, recommended depth of discharge (DoD) and round-trip storage efficiencies.
[This article was originally published in May of 2015.]
Compare solar & battery system prices in your area
Compare Solar & Battery Quotes
$/kWh just doesn’t cut it
Because the task of battery selection can be so complex, most media articles on the matter tend to simplify figures and compare batteries based on their $/kWhcapacity value. To calculate this figure, the price of the batteries is simply divided by the nominal storage capacity at full charge. Although somewhat useful in comparing batteries of the same type across brands and models, this metric can be inaccurate and quite misleading because it does not take into account the following important factors:
- The cycle life of the battery: If the battery only lasts one cycle (as opposed to say 5,000 cycles) then the price of each kWh you extract from the battery would be astronomically high! This figure is typically given as the number of cycles it takes for the true battery storage capacity at full charge to reach 80% of the nominal capacity, given as a function of DoD (below).
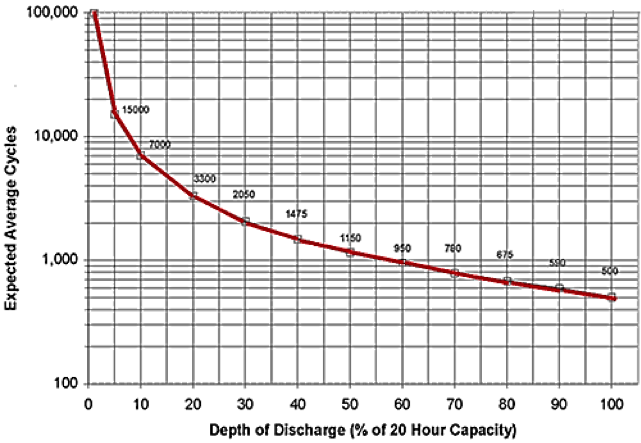
- Depth of discharge (DoD): The depth of discharge specifies what percentage of the battery capacity has been used. For example, if a 10kWh nominal capacity battery has 5kWh stored in then its current DoD is 50% – if it has 2kWh left in storage then its DoD is 80%. Most batteries simply can’t be drained of all their stored energy. In most cases, doing this would cause irreversible damage to its components. Batteries are typically specified a recommended maximum DoD for their nominal cycle lifetime (e.g. 3,000 cycles at a DoD of 50%) and the expected cycle life of a battery tends to decrease as the DoD is increased.
 An example graph of battery cycle life as a function of DoD [Image Source: Electropaedia]
- Round-trip efficiency: This can be thought of as the amount of energy that can be extracted from a battery as a percentage of the amount of input energy it took to store it. For example, if 1kWh of electricity is fed into a battery and the amount of energy which can be extracted from that input is only 800Wh then the efficiency of the battery is 80%. The loss in energy is caused by heat or other inefficiencies within the system. In truth, the round trip efficiency is actually dependent on the battery’s DoD – however, this figure is typically given just as the average.
As outlined above, the $/kWh figure is nowhere near sufficient to fairly contrast competing battery models and types. In order to progress the discussion further, we need to introduce a more appropriate metric, the cost of stored stored energy (COS). This is a much closer approximation to the true cost of battery storage.
Check out Solar Choice’s Battery Storage Product Performance Comparison Tool (plus others in our Calculator Resource Library).
Sample calculations for COS
The three hypothetical batteries listed below will be compared against each other based on their respective $/kWh and COS values to provide the consumer with as much insight as possible before buying a battery. Ultimately, this analysis will provide a more accurate view of which battery stores energy at lowest cost compared to the rest (i.e. has the lowest COS). A similar approach can be used to compare any other battery with available information.
Example battery specifications
| Cost ($) | Capacity (kWh) | Cycles | DoD (%) | Round Trip Efficiency (%) | $/KWhcapacity | |
| Lead Acid Battery | 3,100 | 8.2 | 3,000 | 50 | 80 | 378 |
| Li-ion Battery 1 | 3,000 | 7 | 2,000 | 50 | 92 | 429 |
| Li-ion Battery 2 | 3,500 | 10 | 1,500 | 80 | 92 | 350 |
COS values for the three batteries are calculated using the equation below. Note that this calculation has been simplified to assume that the battery capacity does not degrade towards 80% as the number of cycles increases – the equation can be modified to include this if required.
Summary Table
| Cost ($) | Capacity (kWh) | $/KWhcapacity | COS ($/kWh) | |
| Lead Acid Battery | 3,100 | 8.2 | 378 | 0.32 |
| Li-ion Battery 1 | 3,000 | 7 | 429 | 0.47 |
| Li-ion Battery 2 | 3,500 | 10 | 350 | 0.32 |
In this particular scenario, the cheapest $/kWh battery option does not have much of an overall COS advantage over its slightly more ‘expensive’ lead acid counterpart. It should be clear that the specific COS value should be the dominant metric – unfortunately this is not something that is placed onto manufacturer’s spec sheets and must generally be calculated.
The effect of DoD on COS
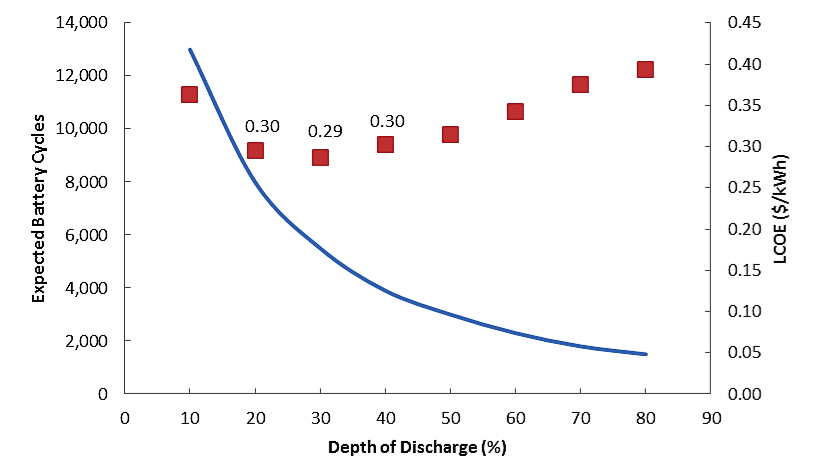
As the graphs above have already alluded, the cycle lifetime of a battery depends strongly on the DoD for all those cycles – in general a higher average DoD per cycle can significantly decrease the lifetime of the battery. To build further on the conclusions of this exercise, the graph below provides the COS as a function of the DoD for the lead acid battery example outlined above.
The expected battery cycle lifetime and corresponding COS for the lead acid battery option above, given as a function of DoD. The blue curve represented the expected cycles and the red data points are the corresponding COS values.
This trend outlines the fact that there is an optimal DoD operating point at which the COS – and thus the true cost of the battery – is minimised. This should dictate the way a system is operated (i.e. shallow or deep cycling) and sized. The DoD for this particular battery should be maintained at around 30% to prolong its lifetime energy production or, conversely, the system should be designed such that the average DoD is kept as close as possible to 30%.
A spectrum of choices
There are many more additional factors which can be considered – such as maintenance, toxicity, safety and disposal – to compare against but as the examples above have highlighted, looking at commonly available fine print can cut through the mess and help you identify the best value battery storage options.
Compare solar & battery quotes from installers in your area
Compare Solar & Battery Quotes
Top image by Claus Ableiter, via Wikipedia.
© 2017 Solar Choice Pty Ltd

Hello,
I consider this information quite interesting.
Just out of curiosity, what is the recommended literature for COS calculation.
Have you considered the BEP (Break-Even Point) calculation, for the batteries?
Best Regards!